Overview
Some common purposes of the Google Maps are:
- Map a list of available products and where your customer base may find them
- Visualize the location of your nationwide fleet
- Embed closed order addresses to determine shipping logistics
- Map a list of current clients to see what geographical areas need more of your sales attention
- Create a graphical representation of your partners’ locations for easy customer search
Instructions
Please follow the steps below to integrate a Google Map inside of your web application.
Configuring the Google Maps API key
Once you have your API key value as mentioned above, you will need to insert this into your Runtime Application Settings screen (mrc_servlet_config.xml file). This is accessible from the Admin menu -> Dictionary Configuration -> Runtime Application Settings. Open text mode from the ‘More’ button on the right. Find the following property and insert the API key value into the empty value string:
<google-map-key pdesc="mapkey" value="" />Save the file and restart Tomcat. This will need to be performed for each data dictionary that you will like to utilize Google Maps functionality in.
Inserting a Google Map into an application
The following steps need to occur each time you wish to generate a map:
1. Click your cursor in m-Painter where you’d like to insert the map.
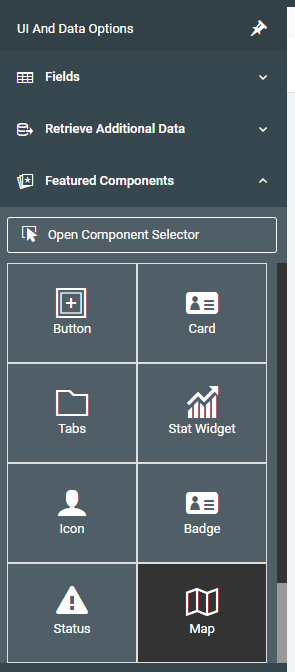
2. On the left side panel, expand “Featured Components” and select the Map option.
3. A helpful pop-up will appear that will allow you to choose where you would like your data to come from (a Data Model or an existing m-Power application).
4. After telling the map where the data is coming from, click the “Next: Map Configuration” button.
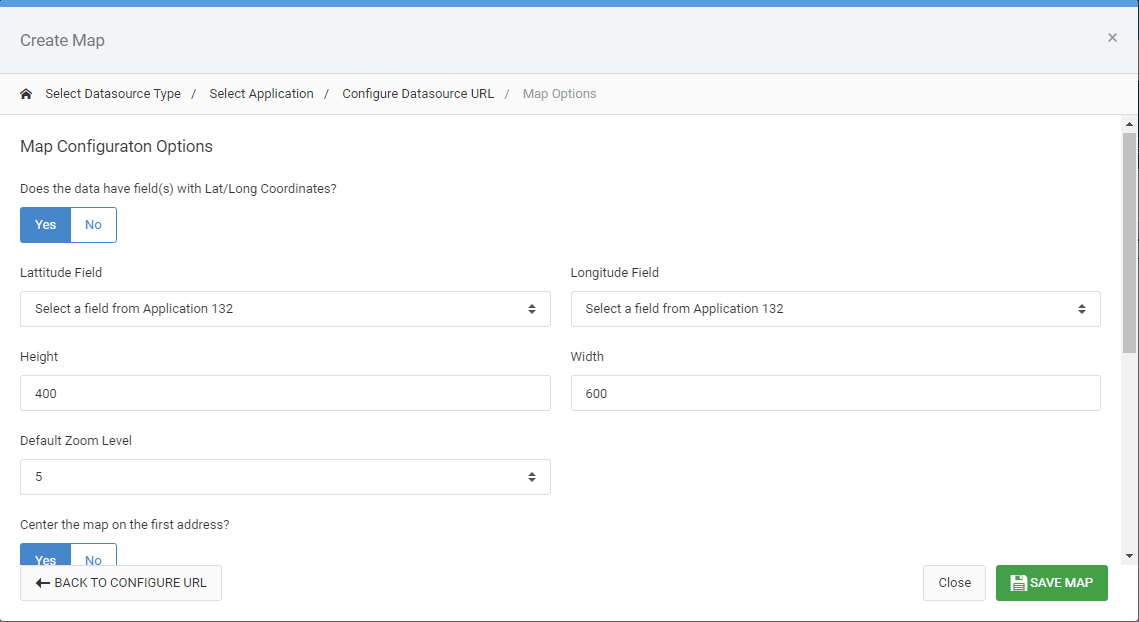
Your first decision is to tell m-Painter if you will be supplying your map with Longitude/Latitude points. If you don’t have them, select No.
If you are supplying an address, us the green “< Fields” button to choose your address fields.
Ability to control the Width and the Height of your map. By default this is measured in pixels, however other valid CSS Units for measurement can be used if desired (%, vw, vh, etc.).
Control the Default zoom level (The higher the number, the more zoomed in the map is by default).
The ability to control default centering (By default, maps will center upon the first address, however you can only center by Latitude/Longitude line)
The ability to control the marker type (By default the marker will be the red Google flag, however, you can conditionally use different images by entering the path to an image within a calculation. In this case, you would select the given calculation from the Custom marker image dropdown.
Show marker info allows your end user to control how they see additional “balloon” information. By default, the option is on click. However, changing the value to “Mouseover” will activate the balloon window on mouse contact.
Marker Text Info — This option controls what data is seen in a balloon pop-up when a user clicks on a marker within the map. As a developer, it is your decision what data, if any, should appear in the balloon pop-up.
Map Template — In the event you wish to extend the logic provided via the map, you do have the ability to customize the necessary JavaScript code that is used to facilitate communication via Google’s API.
When completed, press “Save Map” and Save your application in m-Painter.
When your application executes, you will see your Data markers begin to fill the screen as a progress bar within the map informs you of how many points have been populated:
Once completed, your map will look something like this:
Notes
Question: I cannot/do not want to use Google Maps. Are there other alternatives?
Answer: Yes there are. Please contact support and we can walk you through alternative mapping options.