This document explains how to setup your report applications to take advantage of the Group By functionality and also contains information pertaining to additional configuration options.
What is the Group By Feature & why do I want it?
The ability to group data by a specific value allows you to effectively create summarized data without the need for detail records. You select a field by which to subtotal and the SQL statement will sum all numeric fields for that subtotal and output them on the subtotal line. No detail lines will be printed, nor will any time be taken to analyze the detail line by m-Power.
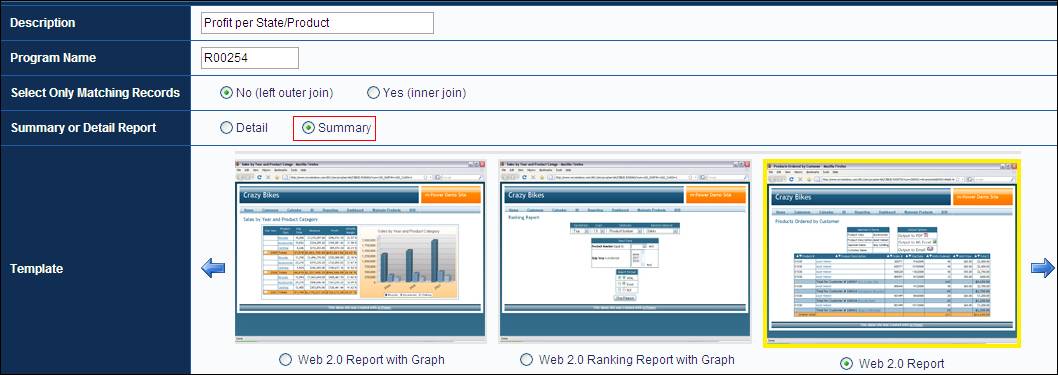
For instance, let’s say my business, www.crazybikes.com, ships products to all 50 states. When I review my sales history for the previous year, I may have upwards of 100K records in my table. Naturally, I am not interested in each particular detail line, but I do want to know high end information. For instance, what is my Profit per State, or perhaps Profit per Item? With the update, all I need to do is set my Report to be a “Summary Report” (This option is available in the Application Defaults screen), and subtotal by State and by Item. When I run my report, it will group by both State and Item and output only subtotal information. Since I am only outputting Subtotal information, the usual 10K record governor will be ignored.
How is this different from my current reports?
Currently, m-Power reports must compute detail records in order to total them at Subtotal/Grand-total time. This process takes both time and database resources to compute. However, with the GROUP BY feature, the SQL statement is modified to let the database GROUP BY key values. This eliminates the need for m-Power to compute each detail line. Prior to this update, to do something like this in the current m-Power, you would need to create a summary file first, then a report over the summary. This feature allows you to skip the process of creating a summary and, instead, go directly to building your report.
Ok, you’ve sold me on why I need it, but how do I implement it?
This feature comes standard on all Reports. However, if the Detail level of Data is checked on the prompt page, the GROUP BY functionality will not occur. Simply put, if you want to see detail information, there is no advantage to running a GROUP BY statement. This detail option is checked by default, however you can remove it per application in the Application Defaults screen. Please see below:
Note: Alternatively, you can remove the Checkbox via m-Painter, or your end-user could simply uncheck prior to running their application.
Note: The GROUP BY functionality is disabled in a Report by default if any of the following conditions are true:
· The use of Application Calculations exist
· The use of External Objects exist at a Detail level (Using External Object Locations of *JCALCOBJ or *JREADRCRD)
The reason for this is that it is assumed if either of these is true, your goal is to determine Detail information, not Subtotaled Information.
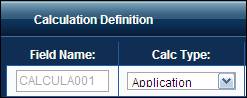
Note: The majority of user calculations will not cause any problems. Only when you have selected a Calc Type of “Application” will Group By be disabled by default (see image below).
What configuration options do I have?
All configuration options can be found in Application Properties. Once Application Properties is open, navigate to the “Column SQL Type” tab.
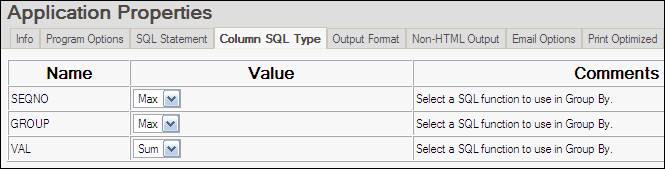
Notice that all Alpha fields have a value set to “Max” while all Numeric Fields have a value of “Sum”. This is the default setting; however Alpha values have the option of “Max” or “Min”. Numeric fields have the option of “Max”, “Min”, “Sum”, or “Avg”.
· Min — SQL examines all values for this field and returns only the smallest one from the group (Available for all fields).
· Max — SQL examines all values for this field and returns only the largest one from the group (Available for all fields).
· Sum — SQL examines all values for this field and adds the total. It then returns this value to the screen (Only available for numeric fields).
· Avg — SQL examines all values for this field and adds the total. It then divides the total by the number of records it added. It then returns this value to the screen (Only available for numeric fields).
Lastly, click the “SQL Statement” tab to see an additional option.

Modify this setting if you are using either Application Calculations or an External Object at *JCALCOBJ or *JREADRCRD and still want to use the GROUP BY functionality.
Note: Any Application Calculations or External Objects being called at *JCALCOBJ or *JREADRCRD will be computed only on a subtotal level.
How can I implement this in my Existing Applications?
To ensure compatibility with current applications, this functionality will only be available to you if you recompile your application and overwrite the HTML Presentation Layer and XML Properties File.
Additionally, you have the opportunity to copy an existing application to a new application.