Often times when creating a Line Graph, you will have a need to create a “Goal Line” (or Reference Line) that will serve as a constant horizontal line to track if you have met a certain goal. Setting this up with a Report with Graph is very straightforward. In the following example, I am going to print a set of users Credit Limit, and compare that with a static “Target” goal.
Goal Line
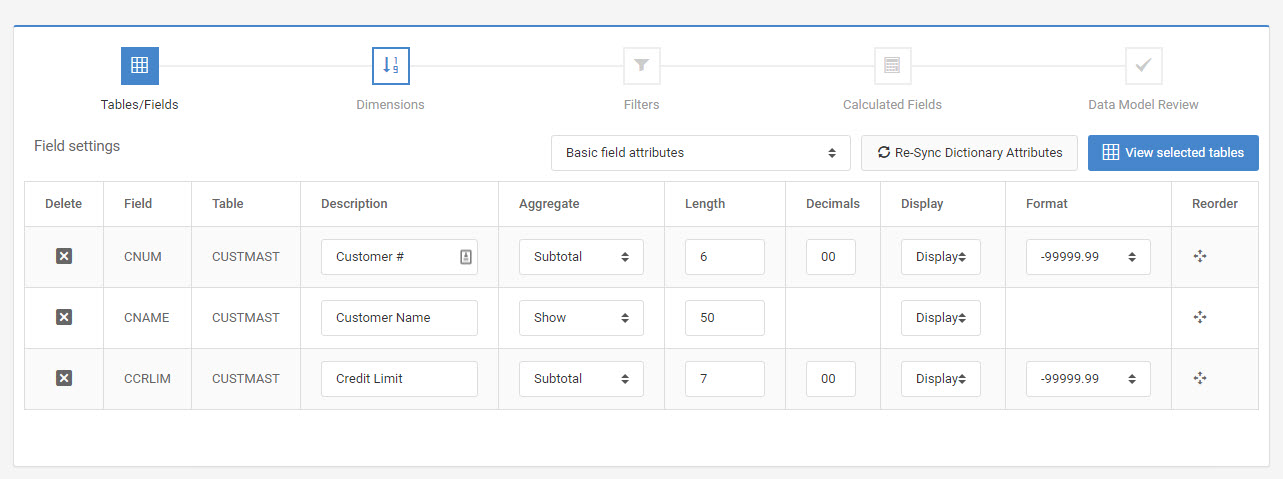
Below, you can see I plan on graphing the Credit Limit Field (CRLIM).
However, I need to create a target goal; this can easily be done with a calculation. I will set my calculation to $15,000.
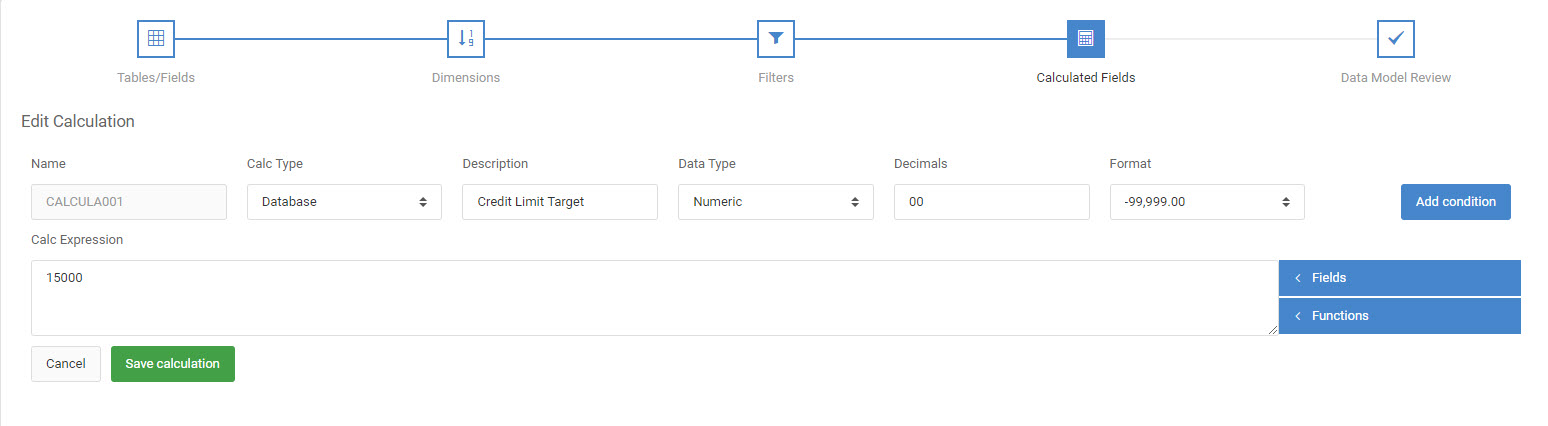
As you can see, I have simply set a calculation equal to 15000.
m-Painter Changes
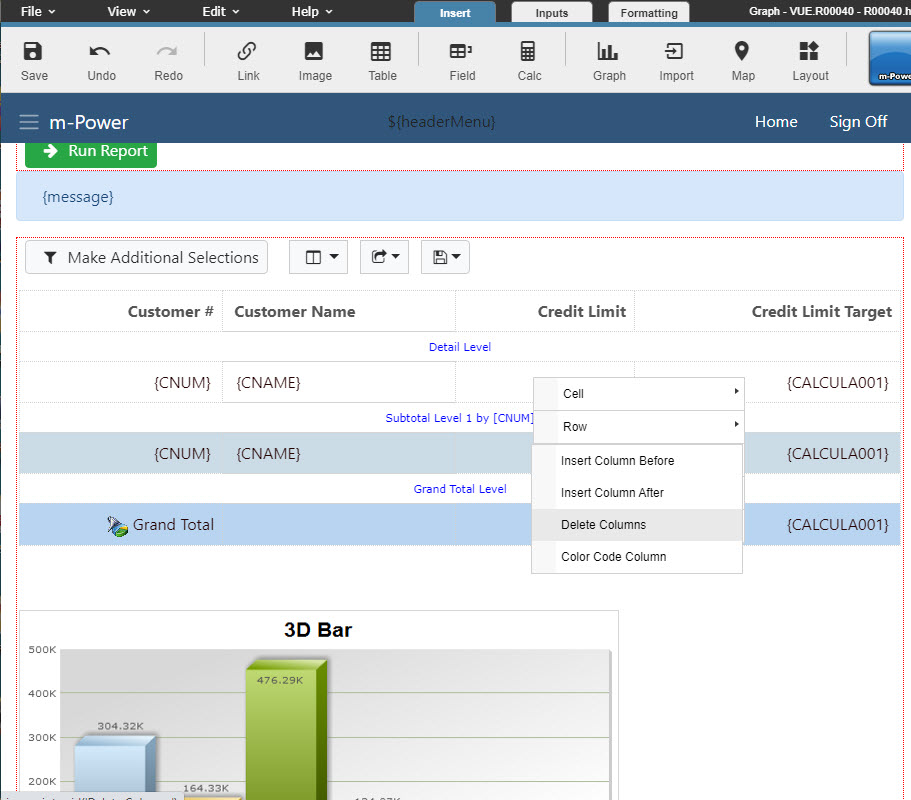
After I build my application, I must go into m-Painter. The first thing I will do is remove the calculation column. Since this will only be used in the graph logic, it does not need to be present in my output table. Simply right-click on the column, and select “Delete Column”.
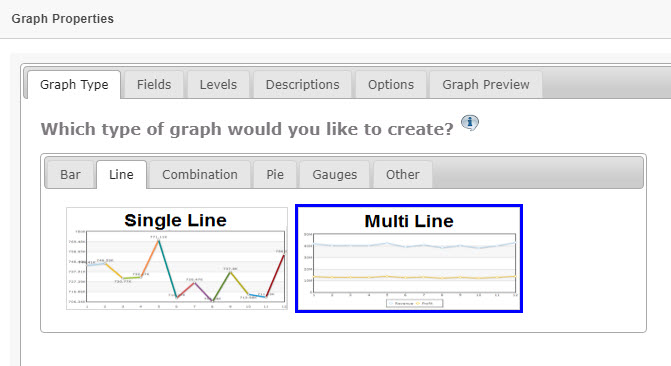
Graph Properties
Next, I will need to modify the Graph Properties. To do this, right-click on the graph, and select “Graph Properties”.
The first thing that we will need to do is select the “Multiple Line” graph on the “Line” tab.
Then, select the “Credit Limit in Dollars” and “Credit Limit Target” fields on the “Fields” tab.

Next, on the “Levels” tab, we need to change the level to the “Detail Level”, not the “Grand Total Level”. This is necessary because we need to have data for each individual customer, not just the grand total.

Before we finish, we need to make one more slight change. Click the “Options” tab and then select the “Chart and Plot” section. Set the “Show X Axis Item Values?” value to “No”.

This change will clean up the graph quite a bit, as it will not try to write the value for each customer on the line, making the graph illegible.
Click “OK”.
Click the “Save” icon, and then run your application.
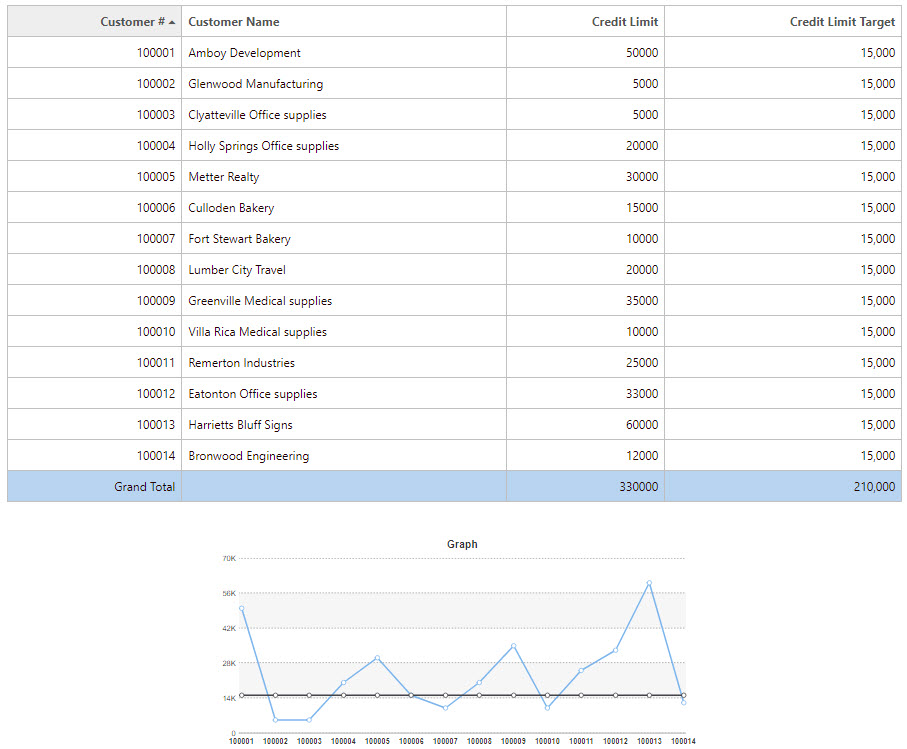
Runtime Usage
Your output should look something like this: