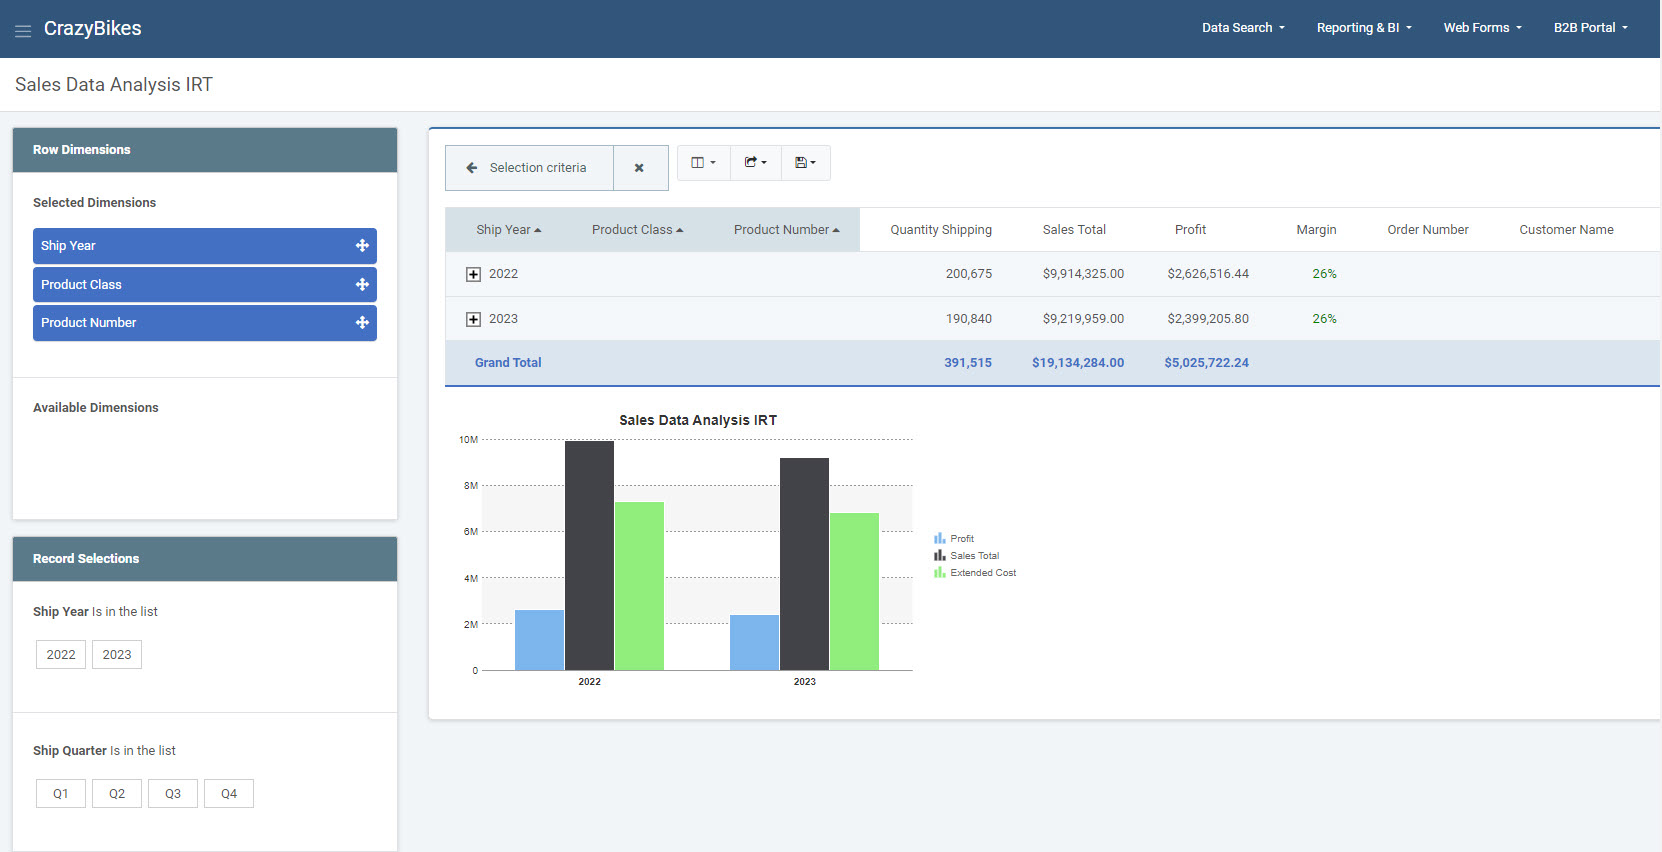
Interactive Reports are applications that can be easily worked with by end-users to create dynamic displays of data. These applications offer features like a collapsible record selection screen, automated drill downs, and flexible graphing. In addition, since the an Interactive Report works over live data, there is no need to create additional levels of data-warehousing, drastically reducing development time.
Templates Features
Below lists out all the template features offered by the Interactive Report template.
Tables/Fields
Here you will see/modify the primary table you have selected for your application. Here you can create or modify joins to other tables as well.
To learn more about the Tables/Fields section, please see here.
Field Settings
Here you will find the settings for all the fields in the application. You can find out more in detail about these options here.
Dimensions
Here you can select the field that your application will sort and group by at runtime. You can have multiple dimension fields as well as re-order the dimension fields to fit your application’s needs.
Users can modify this at run-time. If you wish to have dimensions available by default, be sure to set “Subtotal” to Yes. If you would like the ability for the user to select this, without it being the default, be sure to select “Subtotal” to No.
There are a few additional things to keep in mind when selecting dimension fields for an Interactive Report:
- Drilling Down: Only dimension fields offer the drill down functionality.
- Sorting: In an interactive report, you can only sort by the first dimension field and non-dimension field.
- Runtime Display: Fields are added to the output of an interactive report in the order they are listed in Field Settings. If you return to an application and add an additional dimension key, that field will not be moved to the leftmost side of the screen. Therefore, after making any dimension changes, it is suggested that you check if the fields are listed in the correct order in Field Settings.
To learn more about Dimensions, please see here.
Filters
Filters can be created over any database fields or calculations. They allow you to restrict the records that will be returned from the database at runtime.
To learn more about Filters, please see here.
Calculations
Fields that will apply to the current application only. This can be used to include SQL code in a field, such as cast a numeric field as character, create date conversions, inserting the current date and time, and much more.
To learn more about Calculations, please see here.
External Objects
This feature allows developers to connect m-Power application with their current business logic, or to extend m-Power capabilities by allowing developers to write their own Java, RPG, or SQL programs, and integrating these programs into the applications. m-Power utilizes “locations” to connect the external objects, these locations vary depending on what the external object does and when it should be executed. The following locations are supported in this template:
*JCALCOBJ This location is used when parameter calculations are present in the application. The external object is called after each row is processed.
*JREADRECRD This location will call the external object after each record is processed.
*ADVRECSEC This location has been deprecated. Learn more about Row Level security.
*STRSEARCH This location has been deprecated.
*STRUPBDFT This location has been deprecated.
*SELECT This location has been deprecated. Learn more about creating dropdown lists using m-Painter.
*RUNVALID This location is used to validate prompt inputs.
To learn more about External Objects, please see here.
Smartlinks
Smartlinks allow developers to easily link one application (Retrieval, Report, or Maintenance) to any other application, passing key data automatically. The benefit of Smartlinks is that it allows users the ability to quickly “drilldown” into other applications based on the selected row. By passing parameters automatically when creating a link in m-Painter, Smartlinks save the developer time by simplifying the process.
To learn more about Calculations, please see here.
Template Properties
The Template Properties screen gives developers template specific settings.
To learn more about Template Properties, please see here.
Additional Notes
- The Interactive Report graph will become activated to become a drill-down image only when the first dimension key is also a filter. This is also a requirement of the tooltip logic.
- Secondary graphs may be added to the application. The graph can only exist on the default, subtotal level one and grand total, levels. It the Image Data Collection icon is placed on any other levels, the graph will not display.
- Only the first six subtotal levels in an Interactive Report will have default formatting. If your application has more than six drill-down levels, you will want to edit the styles pertaining to these levels. You can do so by editing the stylesheet located in Admin -> HTML/JS/CSS Files -> Application CSS.
- When utilizing Runtime Value Prompt Filters in an Interactive Report, it is suggested that you use dropdown lists to populate these prompts, rather than text inputs. However, should you choose to use text inputs, it is recommended that you do so in conjunction with the ‘Run Report’ button property enabled.
- Additional variables can be added to drill-down links. To do so, open m-Painter and search for the text “extraParms”. Place the additional parameters with the quotation “extraParms: ‘ ‘. For instance, if you want to always pass R001=ABC, the extraParms line would read:
extraParms:'&R001=ABC'. - Developers can embed drill-down links where necessary. To add filter selections to drill-down links, add class=”link_with_parms” to the drill-down’s anchor tag.
URL Parameters
A complete list of runtime parameters that can be passed to an Interactive Report template can be seen by using Parameter Listing (help=1) tool.
To launch this feature, simply add ?help=1 to the end of the URL of any m-Power application and hit Enter.
ex. http://mpowerserveraddress:8011/mrcjava/servlet/DICTIONARY.R00010s?help=1
For more information on the Parameter Listing tool, please see here.
Edit Properties
The Edit Properties section allows you to control the behavior of the application. Every m-Power application has properties, however the list of available properties will be different depending on the template selected.
- Program Options
Run Button — This parameter controls, as the name implies, whether a “Run Button” is displayed within your report. Additionally, when the Run Report is activated, run-time record selections are only executed when the button is pressed. However when the button is hidden, record selections are executed immediately after they have been selected. In cases where a user makes numerous selections, you may wish to enable this feature. Doing so will mean the user can make all of their selections at once, then press “Run Report”, rather than having to wait for the report to reload after each selection is made.
Display Data on Page Load — Select No if you wish to suppress data until a user enters in record selection at run-time.
Subtotal Options — Setting this property to “Yes” will allow the end-user to collapse and expand total levels with a single click.
Subtotal Reorder — When this property is set to “Yes”, end-users can change the drill-down order of their data. While very useful, if performance issues arise, you may consider setting this value to “No” to force the user to use the pre-defined drilldown sequence.
Default Subtotal Behavior — This property controls the default behavior of your subtotals at page load. Please note that the more levels you display by default will consume more resources, both at the server and client level.
Smart Selection Logic — Specify whether to enable the Smart Selection logic. If yes, then run-time selections change styles to indicate matched/unmatched data selections. You may want to consider setting this feature to No to improve report performance.
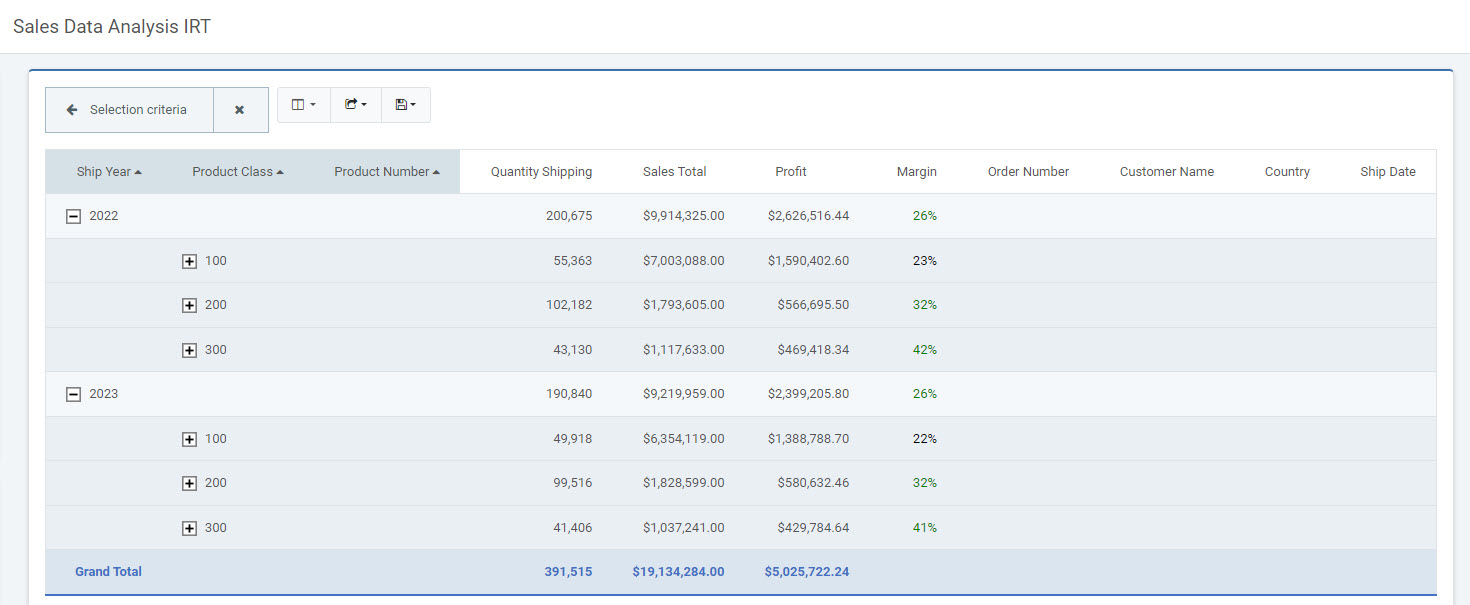
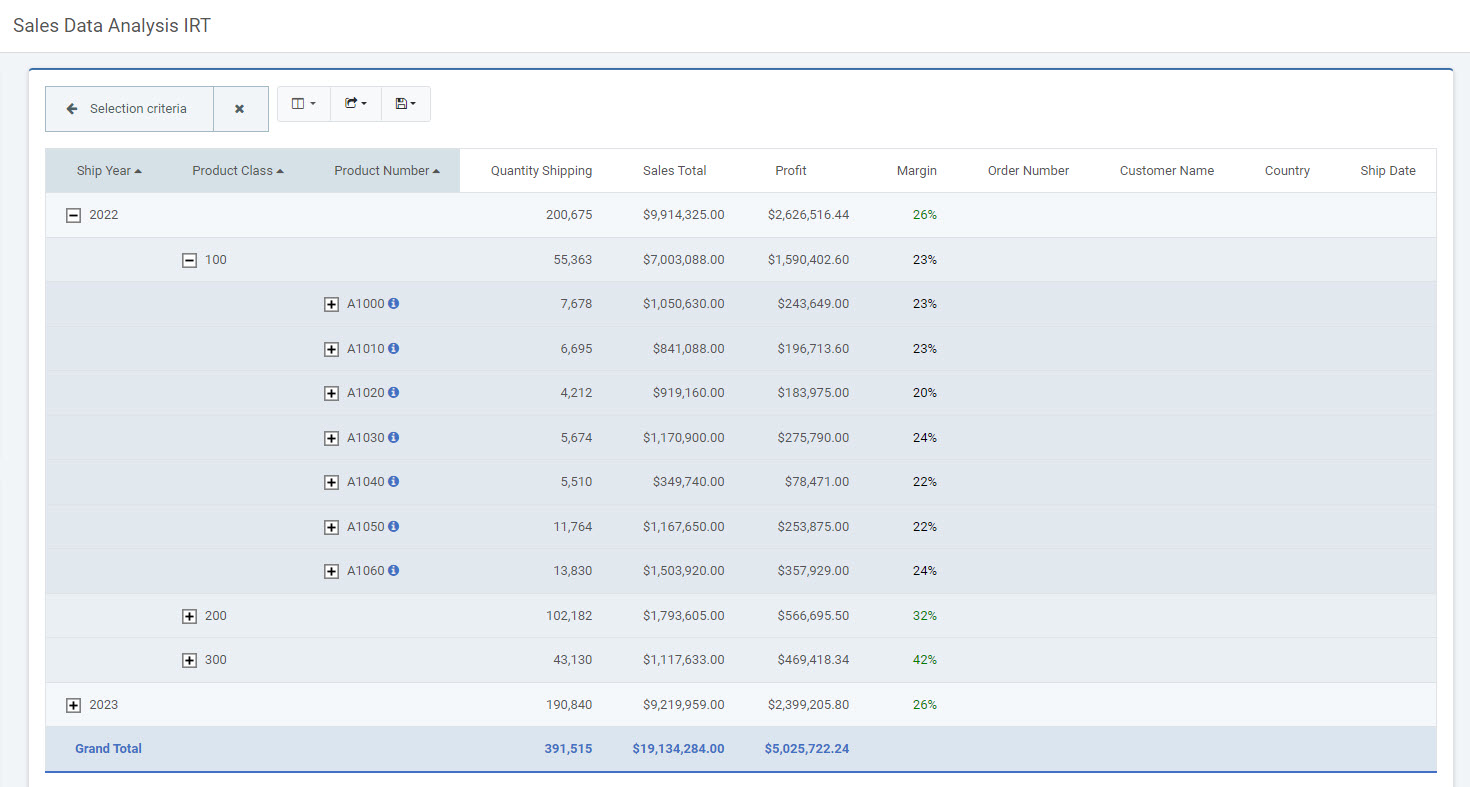
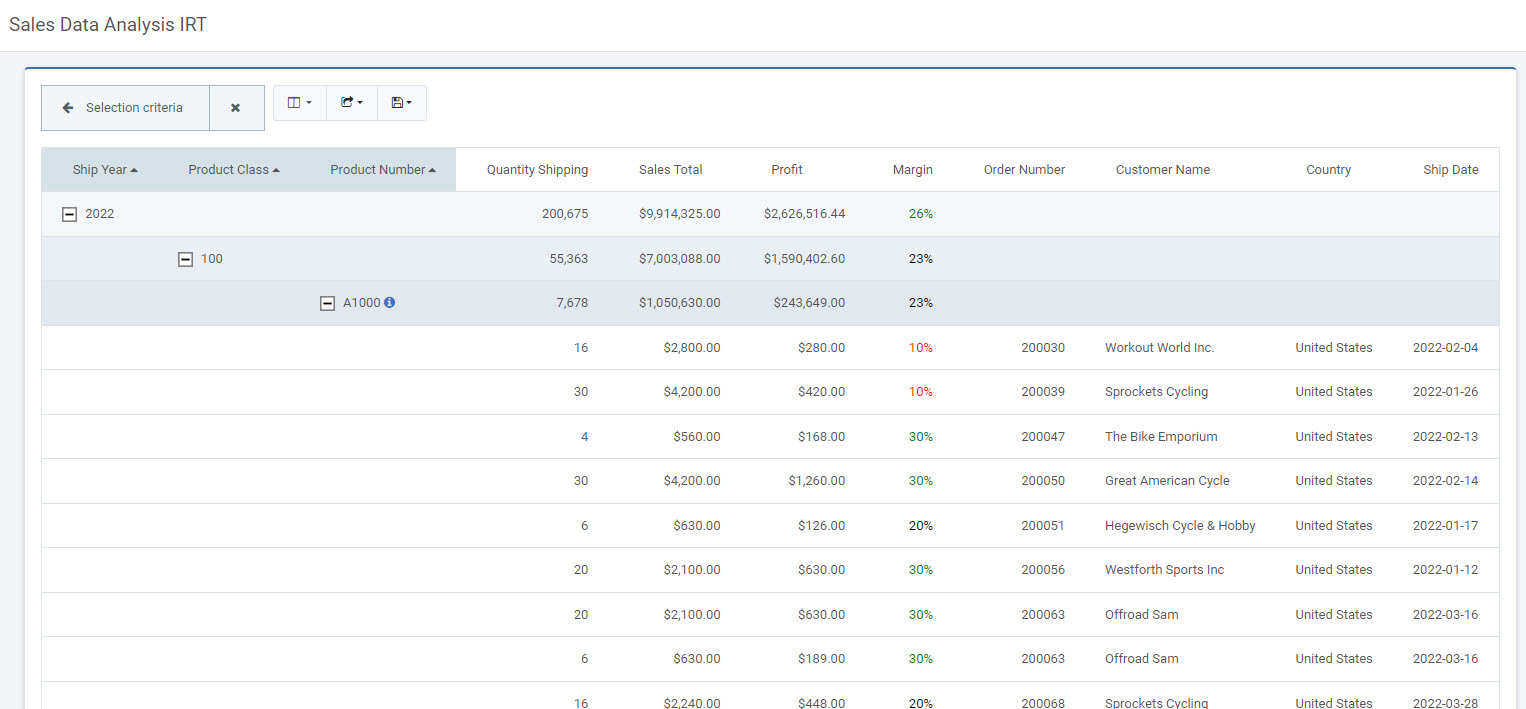
Template In-Action