
Overview
Perhaps you have read the documentation on Creating a Line Graph with a Static Goal Line, however your use case is different. Instead of a static line, you need a dynamic goal line. Fortunately, FusionCharts (the graphing library that m-Power uses) has the ability to display a trendline in your chart and m-Painter will allow you to pass a dynamic value to set the trendline from your data.
Implementation
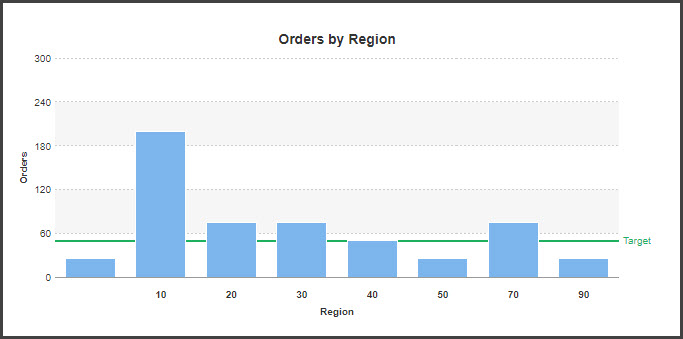
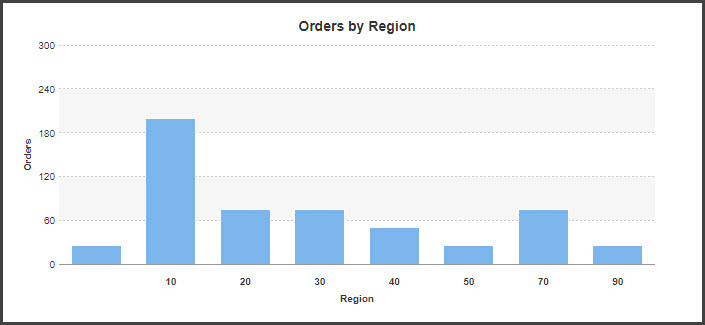
In this scenario, I have a counter calculation in my report to total the number of orders in my region subtotal break. After compiling, I will first need to configure the bar graph to chart the counter calculation. Set the Graph Type to 2D Bar or 3D Bar. Set the counter calculation as the “Selected Field”. Select the appropriate subtotal level to plot the bars. You now have a basic bar chart.
In order to add the trendline, we will need to customize the graph template. From the Options Tab, click “Customize Graph Template”. Once the source code of the graph template appears, click “Customize this template”. Scroll toward the bottom of the code until you find the below code block:
       "data" :
       [
          <#list yvalues as yval>
        ${comma(yval_index)}
           {
               "label" : "${xvalues[yval_index]?json_string}",
               "value" : "${yvalues[yval_index]?json_string}",
                 <#if useTheme == 0>"color": "${colors[yval_index]}",</#if>
               "tooltext": "${tooltexts[yval_index]?json_string}"<#if links??>, "link":"${links[yval_index]}"</#if>
           }
         </#list>
       ]
Immediately after the last “]”, add a comma and append the code block so the full block looks like so:
       "data" :
       [
          <#list yvalues as yval>
        ${comma(yval_index)}
           {
               "label" : "${xvalues[yval_index]?json_string}",
               "value" : "${yvalues[yval_index]?json_string}",
                 <#if useTheme == 0>"color": "${colors[yval_index]}",</#if>
               "tooltext": "${tooltexts[yval_index]?json_string}"<#if links??>, "link":"${links[yval_index]}"</#if>
           }
         </#list>
       ],
"trendlines":
	[
	   {
	     "line": [
		  {
			"startvalue": "${prop('TARGET')}",
			"valueOnRight": "1",
			"color": "#1aaf5d",
			"displayvalue": "Target",
			"thickness": "2"
		  }
	       ]
	    }
]Click “OK” and save m-Painter.
You will now have to create the custom variable to pass into the chart template we just created. To do this, you will need to disable the WYSIWYG Graphical Editor of m-Painter. From the App Properties -> Program Options -> Enable Graphical Editor -> Select ‘No’ and save. Reload m-Painter to get see the source HTML.
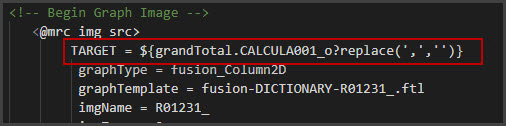
Search for <@mrc_img_src>. Immediately below the <@mrc_img_src>, insert the following line:
TARGET = ${grandTotal.CALCULA001_o?replace(',','')}
Save m-Painter and run your report to see the new bar chart with trendline.
To further customize your trendline, you may include any of the attributes found on the FushionCharts Column 2d Documentation under “Trend-Lines”.