 Summary: Many businesses treat dashboards as tools reserved for executives. They only give decision makers access to the dashboards they need to monitor the business. While dashboards certainly help business leaders run the company, they are so much more than that. In this article, you’ll learn a few ways companies can use dashboards to improve other aspects of the business.
What comes to mind when you hear the term, “Executive Dashboard?” Do you imagine business leaders sitting in their office, analyzing charts and graphs? Do you think of dashboards as executive tools?
 If so, you’re not alone. Many businesses treat dashboards in this way. They give their decision-makers dashboards to track the business…but don’t use dashboards in any other ways.
The problem: They’re missing out on the full benefits of dashboards.
You see, dashboards are far more than executive tools. They can improve all aspects of your business.
How? Today, let’s focus on just a few ways businesses can use dashboards outside of the executive realm. Below, I’ve outlined and explained 5 different ways dashboards can improve your business. You can use dashboards:
1. To motivate employees
Gamification is a growing concept in the business world. It’s the concept of applying game mechanics to engage and motivate people to achieve their goals.
For instance, many businesses provide goals and rewards for their employees. Using dashboards, your employees can track their progress towards a reward, and compare their progress to other employees.
“Companies do themselves a disservice when they only use their ‘business dashboards’ as a tool for executives to watch how the enterprise is performing from an overall perspective,” says Tom Renda, Vice President–New England at Eliassen Group. “At Eliassen Group, we have constructed multiple electronic dashboards that our sales executives and recruiters have direct access to via our corporate intranet that allows them to see how they are performing against their colleagues. This fosters a spirit of friendly competitiveness and allows them to track the progress they are making with existing and new clients, whether they are expanding their base of IT consultants, etc. This information also allows them to see where they need to be at different intervals throughout the year to become eligible for their financial bonuses and to earn free vacations. All of the sales executives and recruiters love having this information at their fingertips. From a leadership perspective, it promotes a spirit of transparency, which is good for maintaining a positive attitude within the ranks.”
2. For your customers
 It doesn’t matter what business you’re in. Chances are, you can give your customers important data via a dashboard.
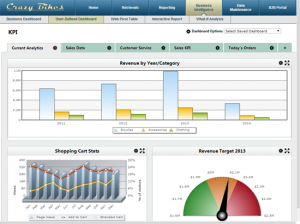
For example, energy companies should provide dashboards that show energy consumption. Their customers should be able to see energy usage on a daily/weekly/monthly basis, and even see how they compare to similar households.
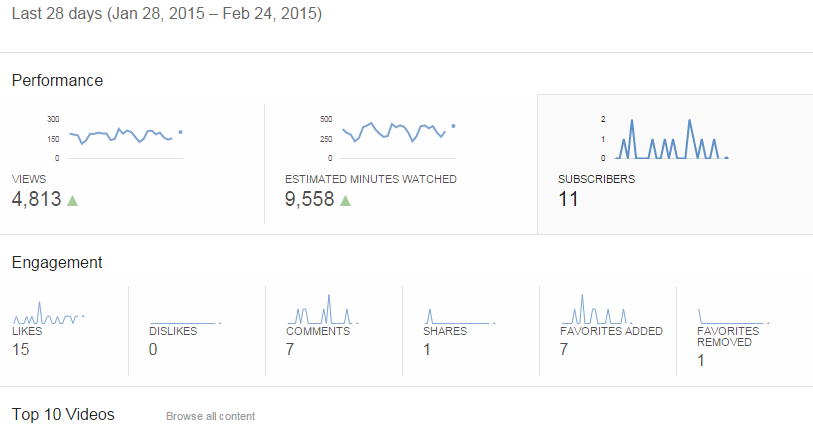
YouTube is another great example of a customer-facing dashboard. If you have a YouTube channel, you’ll notice they provide a great dashboard with your video statistics. It shows likes/dislikes, views, subscribers, views over time, and more.
I could go on with hundreds of examples, but I’m sure you get the point. If you have customers, think about how you can give them the data they care about in a simple dashboard format?
3. On the shop floor
In the manufacturing industry, real-time data is essential. Those on the shop floor need to know where they are in relation to their daily production goals. Those managing the shop floor need to know of problems as they happen.
The solution to both cases: dashboards. For instance, some manufacturing companies mount monitors on the shop floor with real-time dashboards. These dashboards show employees where they are in relation to their production goals on a daily basis.
“On the shopfloor, you have to monitor your progress on a daily basis,” explains Feliks Golenko, Dashboard Specialist at Multibase. “What was produced? Were there quality problems? Is the effectiveness where it should be?”
“On a shopfloor you have two different types of work: manual labor and machine work. In terms of manual labor we talk about productivity. In terms of machines we talk about OEE (Original Equipment Effectiveness). These metrics need to be monitored and optimized in real time. This is where you get a huge leverage with dashboards. The sooner you spot that there is a problem (e.g. machine not performing as it should be), the sooner you can do something about it. If the executive team just sees a report about this at the end of the month, the only thing you can do about it is to say: ‘We had a problem.’”
4. As internal monitoring tools
In the recent article, “7 ways small IT departments can accomplish big things,” we explored the importance of being proactive. IT departments stuck in a reactive state will spend their time reacting to problems, rather than taking charge. They run around putting out fires, rather than preventing the fires.
How can they become proactive?
As mentioned in the article, monitoring tools will help. For instance, suppose you had a monitoring dashboard that displayed device health. You could instantly see if a hard drive is nearing capacity, whether or not a computer’s antivirus is up-to-date, and more. Displaying all of this data in a simple dashboard will help your IT staff address problems before they get out of hand.
5. Combined with forecasting elements
I include this point because it’s a great spin on a traditional dashboard…with one key twist: forecasting. As explained below, adding a forecast to your dashboard for the upcoming week helps improve performance.
“We use our company dashboard to monitor top level performance much like many other companies,” Sean Mallon, CEO of bizdaq. “However we use our dashboard to not only monitor weekly performance, but to allow our top level team leaders to forecast the following week in a section titled “What does good look like?”. Here we enter a simple paragraph that outlines what a good week next week would look like – and we review it the following week to see whether we reached “good”. Using this in our dashboard allows us to move beyond objective results and document our immediate plans. It works.”
Summary
Now, these are just a few dashboard ideas, but there are plenty more. If you have a unique way to use a dashboard, I’d love to hear it. Feel free to share in the comments.
Great article, thanks!