![]() Summary: Business dashboards help organizations get a clear view of their business at a glance. But, some dashboards do a better job of that than others. What’s the difference between the two? What elements must an effective dashboard include? What separates a good dashboard from a worthless dashboard? In this article, we explore the most important aspects of a business dashboard, and explain why each is important.
Summary: Business dashboards help organizations get a clear view of their business at a glance. But, some dashboards do a better job of that than others. What’s the difference between the two? What elements must an effective dashboard include? What separates a good dashboard from a worthless dashboard? In this article, we explore the most important aspects of a business dashboard, and explain why each is important.

As data volumes rise, business dashboard adoption has skyrocketed. More and more companies build dashboards with hopes that it will turn mountains of data into actionable insights.
What happens? Some organizations actually meet this goal. Their dashboards become indispensable business tools. Their dashboards provide a competitive advantage.
Unfortunately, many businesses don’t see these results. Their dashboards don’t drive action. They don’t see much value at all. Their dashboards are little more than charts on a page.
What’s the difference?
More often than not, these businesses are missing one (or more) key aspects of an effective dashboard. When this happens, dashboards fail.
What are the most important aspects of a business dashboard? Today, let’s answer that question. I’ve listed three important aspects of a business dashboard below, with sub-points under each one containing more information:
1. Clean, automated data

In reality, the most important aspect of a great dashboard is the part that gets the least amount of attention: The underlying data. More than any other aspect, the data will make or break a dashboard.
Now, I’m not just talking about your data quality. Obviously, you need clean data–that much is a given. If the data is inaccurate, you’re better off not having a dashboard.
But, besides quality, what other aspects of your underlying data are important in a good dashboard? Here are 2 areas you can’t ignore:
Automated data feeds
It’s a mistake I see all too often. Businesses create dashboards that rely on manual data updates. While it may seem feasible at the time, this mistake can cripple your dashboard.
Why is this bad? Besides the obvious time drain, it leads to out-of-date, inaccurate dashboards. While it may work for a little while, the employee in charge of updating the dashboard will eventually forget to make an update. Or, maybe they’ll make a mistake as they’re updating the dashboard.
The results can be disastrous. The business goes on using the dashboard, without knowing the data is out of date or inaccurate–resulting in misinformed decisions.
If you plan on using your dashboard as a decision-making tool, you must automate your data feeds. Don’t make your dashboard’s accuracy rely on manual processes.
A complete picture
Another big problem I frequently see with dashboards: They only tell part of the story. The dashboard only integrates with one aspect of a company’s data, but doesn’t combine data from different sources.
For instance, a dashboard might pull data from the ERP system, but ignore data in the warehouse management and online ordering system. Some businesses still have a good amount of data floating around in spreadsheets–which doesn’t get included in the dashboard.
If you want an effective dashboard, it must give a complete view of your data.
2. A well-defined, user-focused purpose
Who is using it?
A single dashboard cannot be all things to all people. Yet, many make the mistake of creating single dashboards for multiple audiences.
The first step in defining your dashboard’s purpose: Understand your audience. Who are your users? What information do they care about? How do they want to consume data? Each dashboard you create must be geared at a specific user role or group.
“Data visualizations are graphical representations that can help simplify complex points of data,” Phil Strazzulla, CEO & Founder, Select Software Reviews. “Choose the kind of visualization you want based on the end-user of your dashboard – for example, a CEO would want a clear, birds-eye view of the data and its impact in just a few charts, while a business analyst would want more detail.”
What is the user’s goal?
Many businesses take a shotgun approach with their dashboard. They try to give users all of the data they could possibly need.
The result: They have an overwhelming dashboard that just gets ignored.
Before you build a dashboard, talk to your users. Understand their goals. What would a successful dashboard look like to them? What are they hoping this dashboard accomplishes?
“Before you create your dashboard, ask yourself the question: “What problem am I trying to solve?”, says Strazzulla. “Understand the metrics and KPIs that you need to track.”
Which metrics drive that goal?
Too many businesses make the same mistake with their dashboards: They clutter up their dashboards with vanity metrics. Their dashboards may look nice, but they don’t lead to action. They’re nothing more than charts on a page.
The key to an effective dashboard: Knowing the difference between vanity metrics and actionable metrics. What’s the difference? Actionable metrics are those that help you make a decision. They contribute to the dashboard’s purpose.
“In a connected online world there’s almost no limits to the data you can collect and display,” says Lars Skjold Iversen, Search Engine Explorer at Umbraco. “But just because you have the data, it doesn’t mean you have to display it on a dashboard. Identify vanity metrics in your business and try to clear them out of your dashboard.
Vanity metrics should be judged on an individual basis for each dashboard you make. A good way to identify vanity metrics is to look at the purpose of the dashboard and ask “Does this metric alone tell me if things are going well?”. If it doesn’t give you direct and actionable insights to help you with your purpose, then it should probably not be on the dashboard.”
3. An organized, accessible delivery

The final aspect of an effective dashboard is delivery. How will users access and interact with your dashboard?
The “delivery” aspect of your dashboards largely depends on your business, and your dashboard’s goals. However, there are a few key points to consider:
Organization
In general, dashboard organization problems usually stem from dashboards that try to do too much. They try to include too many features, or too much data. They try to fit as much information as possible on the screen. This negates the power of dashboards: Simplicity.
Avinash Kaushik summed it up nicely in his article, Five Rules of High Impact Web Analytics Dashboards: “If your dashboard does not fit on one page, you have a report, not a dashboard. This rule is important because it encourages rigorous thought to be applied in selecting the golden dashboard metric. It acts as a natural barrier to cramming in too much information, makes data presentation easier, makes the dashboard more understandable.”
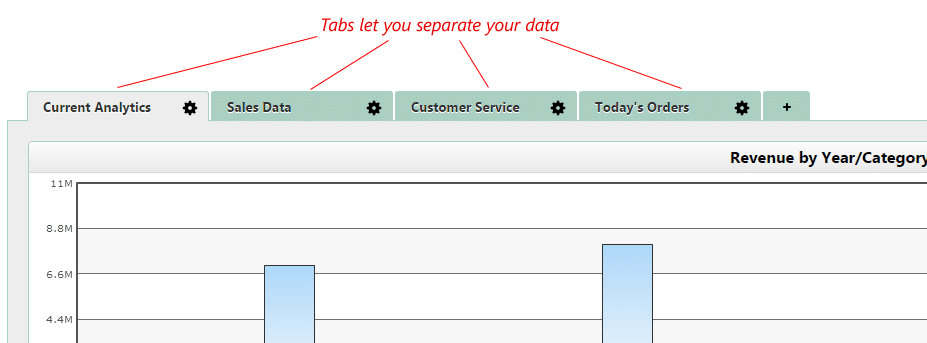
Now, what happens if you need to include more data than can fit on one screen? In these cases, use a tabbed dashboard. A tabbed dashboard lets you segment different data categories into separate tabs. It helps you create organized dashboards that don’t overwhelm the users.
Customization
With dashboards, one size doesn’t fit all. While you may have built your dashboard for a specific user role or department, different users want to see different data. Or, they may want to see the same data, but organized differently.
The problem is, many dashboards still display a pre-determined set of metrics in a pre-set layout. While each department might get their own dashboard, users within that department are stuck with a static layout.
If different users want different information, the dashboard creator gets stuck in an endless loop of customization, creating separate versions of the same dashboard. This not only wastes time, it frustrates the users.
A modern dashboard must include customization options. The user should have the option to pick and choose which data to display, and how to display it. This lets the dashboard creator build a single dashboard that users can customize to meet their needs.
“We’ve tried a good number of business dashboards over the years and we’ve found that the best ones have one common trait – they’re easy to edit and rearrange,” says Malte Scholz, CEO and Co-Founder of Airfocus. “The thing is, your business priorities change, sometimes month by month. Last month, our main goal was to increase the number of our marketing qualified leads. This month, our top goal is to increase our organic traffic by 20%. The best dashboards can be adapted to your goals on the go and just as importantly, the dashboard needs lots of integrations. For example, the organic traffic data we use is pulled directly from Google Analytics – we don’t want to do enter anything manually.”
Go beyond the PC
You may have the best, most useful dashboard ever created. It might include actionable data that drives decision-making. It might extend across the entire business, delivering relevant data to every user.
But, if it’s not accessible whenever and wherever your users need it, is it a useful dashboard?
The fact is, employees aren’t tied to their desks anymore. Dashboards shouldn’t be tied to the desktop.
“Our most used tech device for everyone to get information is our mobile phones and there is where a great dashboard should live,” says Antonio Tajuelo, Product Manager, Data Products at DBi Havas (Spain). “Not all dashboarding tools support native access from mobile devices, but those who do have a big advantage in terms of dashboard adoption. Try to build mobile-friendly dashboards that can be checked everywhere, at anytime.”
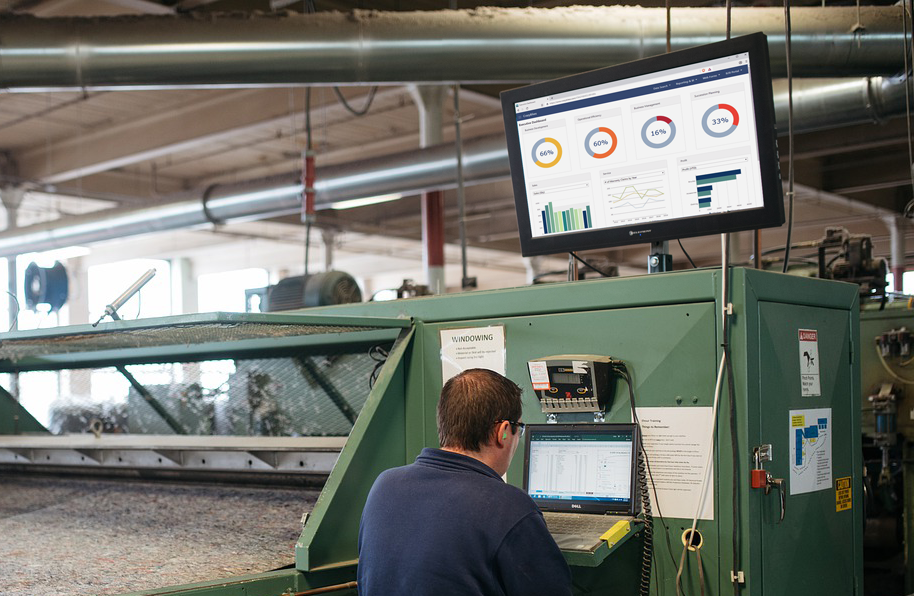
Now, this goes beyond smartphones and tablets, though mobile-accessible dashboards are important. Your dashboard must be accessible to your employees whenever they need it. For instance, I’ve seen some manufacturing companies place monitors on their shop floors just for dashboards. These dashboards track progress and goals throughout the day, and are always accessible to the employees.
Design
Up until now, we’ve focused solely on the function. We’ve explored the underlying principles of effective dashboards. But…don’t ignore design.
Why is design so important? A well-designed dashboard is built around the concept of visual hierarchy. In other words, our eyes automatically process and rank visual data based on specific factors. I won’t get into all of that here, but I covered the topic in more detail in this article.
How can you create a well-designed dashboard? Many dashboard tools include dashboard templates that deliver a decent result. If you don’t have that option, or if you just want to take your dashboards to the next level, talk to a designer. You’ll be surprised at the difference it can make.
“I’ve worked with enough engineers to say with confidence that engineers are not designers,” says Strazzulla. “They’ll give you the data you want to see, but it may not be the most digestible view. Bring in a designer with a dashboard experience to help create a dashboard that users can easily digest and understand.”
Summary
These are 3 of the most important aspects of a business dashboard. What do you think? Would you add anything to this list? If you would like to add anything to this list, I’d love to hear it. Feel free to share in the comments.
Thank yuo for the options
Pingback: elements of a good dashboard 3days - darkhow.com