Levels Tab


In this tab, you will select from what rows in the report the graph will pull its data.

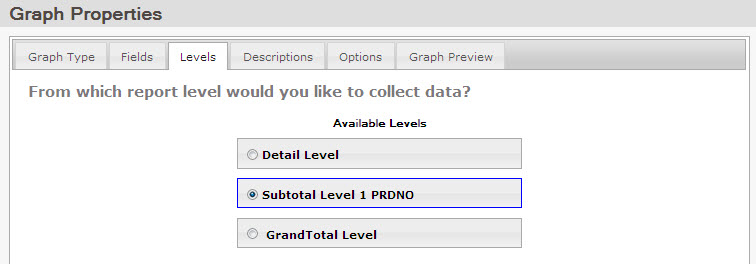
The level of detail depends on what you want to show and where that information is located on your report. Selecting the grand total row will display the final totals in each of the selected numeric fields. This is typically used when making a single line, bar, speedometer or dial chart. Selecting a subtotal row will have the chart display the values from each subtotal row. Single and grouped charts are commonly used with subtotal rows.

Note: Users of the legacy interface should note that this tab combines two settings from m-Power’s previous interface: the Image Data Collection icon, and the detail level setting in your Image Data Collection tab. Instead of moving the data collector icon and modifying each field to match the correct subtotal row, this is all done automatically in this screen with a single click. When you select your level of detail, the icon moves to the correct row in the data table, and the corresponding graph values and descriptions are updated without any extra input.