This tab deals with the legend on the graph:
By default, the legend is turned off. To turn it on, click “Yes” on Make Legend Visible? Note that not every available graph type supports implementing a legend.
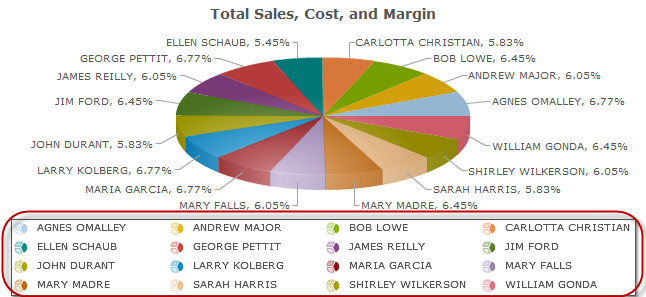
Legend Location
This setting moves the legend to the bottom or right of the image location. By default, it displays at the bottom.
Legend Font
Available Fonts are Helvetica, Arial, Times New Roman, Tahoma, and Sans-Serif. Sans-Serif will make the font be whatever the browser’s default Sans-Serif font is.
Legend Font Style
This setting will make the font Bold, Italic, both, or normal. The default “Normal” will leave the text without bold or italics.
Legend Font Size
The font size can be raised or lowered here. By default it is set to 10 pt.
Legend Font Color
The font color may be a 6-digit hexadecimal value. Alternatively, you can also click on the color wheel next to the text field to pick a color from a palette.