This tab provides options specific to the
- 3D Pie
- 3D Doughnut
- Pyramid
- Funnel Charts
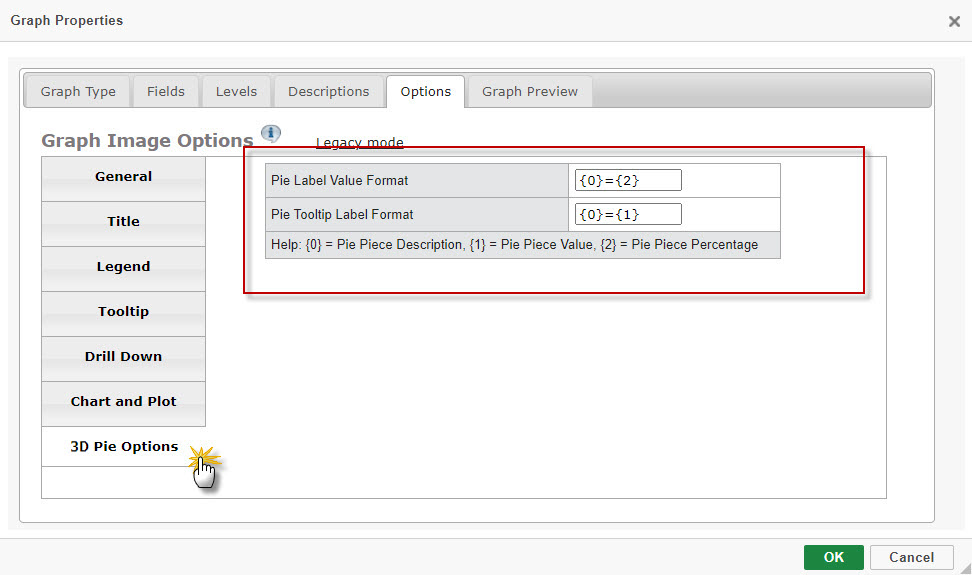
Pie Label Value Format
The Pie Label Value Formats define what values are displayed on the pie pieces labels (indicated by the red arrow).
There are three values that may be used in the format
- The description from the description tab (displayed by entering “{0}”).
- The numeric value of the pie piece (displayed by entering “{1}”)
- The piece’s percentage of the pie (displayed by entering “{2}”).
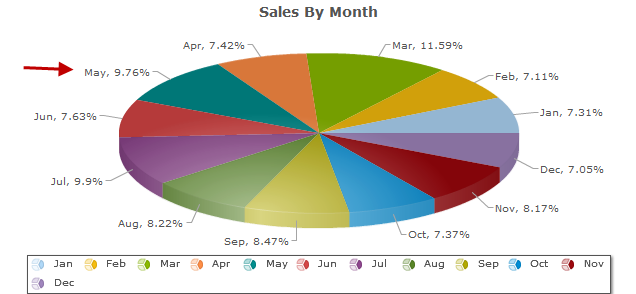
In the example above, the Pie Label Value Format is “{0}={2}”.
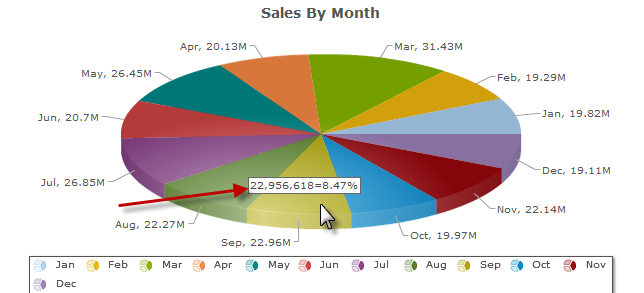
Pie Tooltip Value Format
The Pie Tooltip Label Format defines what values are displayed when a pie piece is hovered on via a user’s cursor (indicated by the red arrow).
The applicable values for the Pie Tooltip Label are the same as the aforementioned Pie Label Value Format. In the below example, the Pie Tooltip Label Format is “{1}={2}”.