Overview
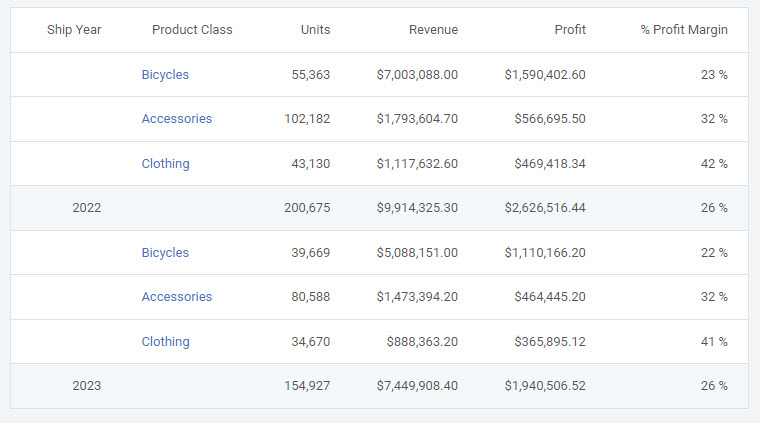
The ability to provide hyperlinks within graphs too often goes unnoticed. To see a working example, see our Crazy Bikes demo site (Sales By Year — Business Intelligence). As you can see the Crazy Bikes report, we have Ship Year, Product Class, Units Shipped, Revenue, Profit, and % Margin fields. I compiled the application as a Regular Report with the Ship Year and Product Class fields as my dimension keys.
Graph Properties
On Crazy Bikes, we are not graphing the grand total; rather, we are graphing the subtotal. To make our example do this, we need to make one simple modification. Open m-Painter, right-click on the graph and select “Graph Properties”. In the “Graph Properties” window, select the “Levels” tab and then choose the radio button next to the “Subtotal” level. Click “OK”.
The final step of this process is to activate the ability to link and to specify the proper URL. Right-click on the graph and select “Graph Properties”. Navigate to the “Options” tab and then select the “Drilldown” button. Within this view, you can activate graph linking and modify it appropriately. In the example below, graph smartlinking is active, and it will link to report 30. It will also pass the Ship Year (SHIPYR) and Product Class (CLASS) to the new report.
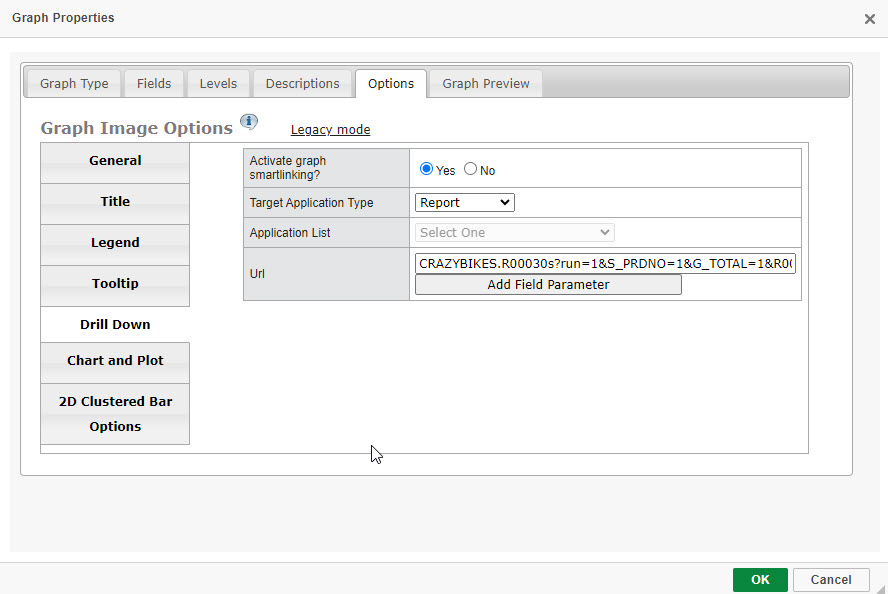
The full URL can be seen below:
CRAZYBIKES.R00030s?run=1&S_PRDNO=1&G_TOTAL=1&R001=${lastRow.SHIPYR?url}&R002=${lastRow.CLASS?url}
Click “Save” and run your application.
Graph at Runtime
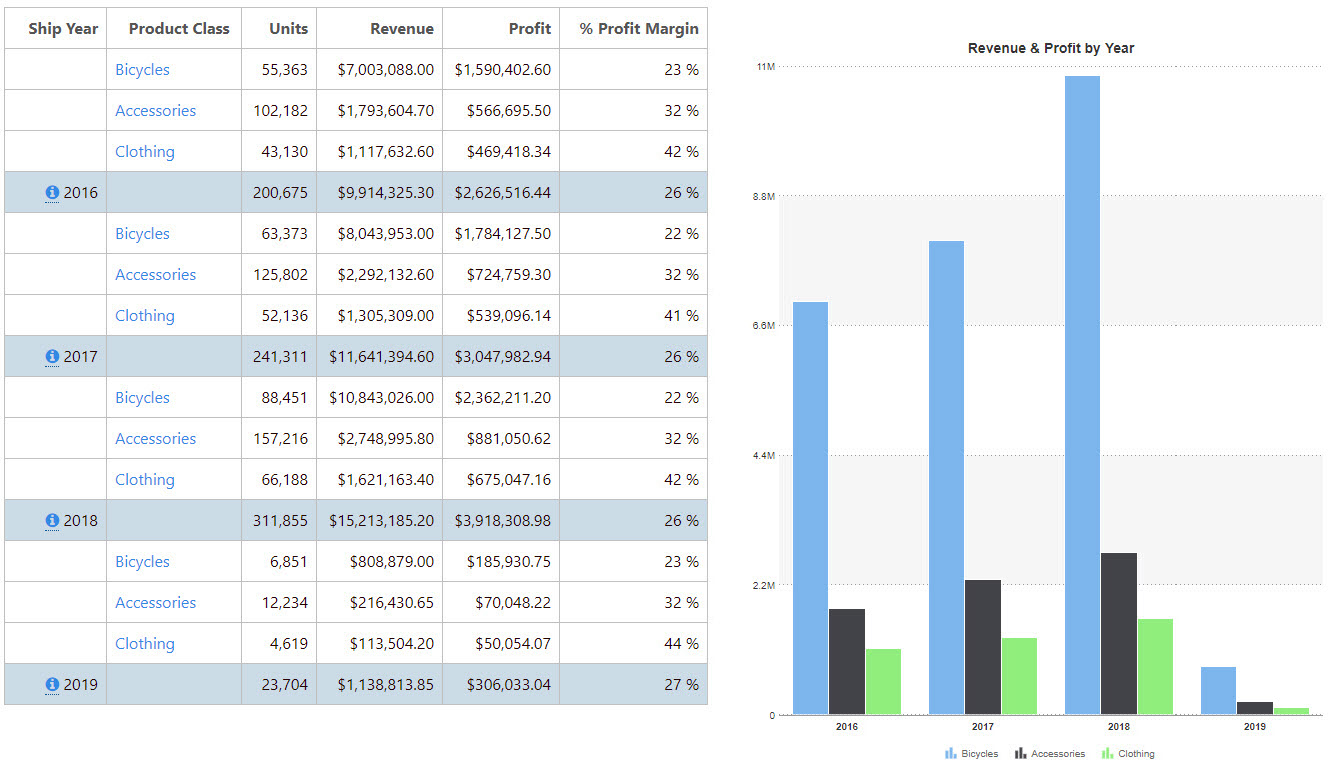
In the Crazy Bikes example from above, at run-time you will see this screen:
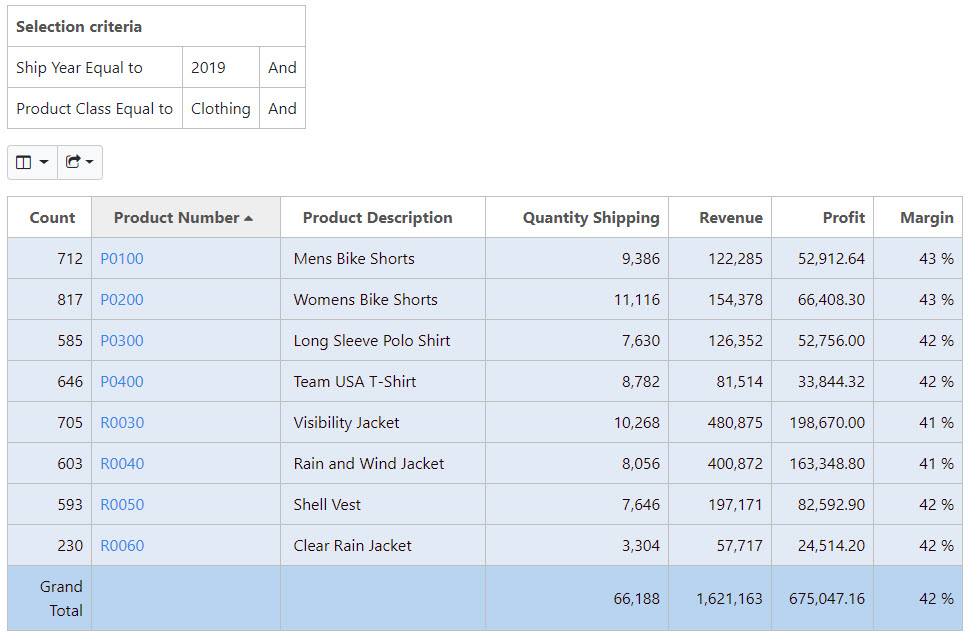
By clicking on one of the graphed bars (2019, Clothing), I am redirected to this page: