X/Y Axis Label Tab
This tab governs the text label on the X and Y Axes:
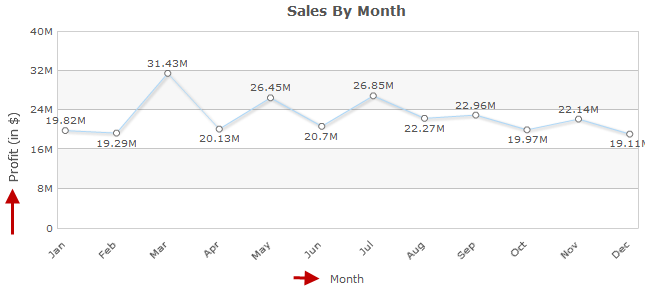
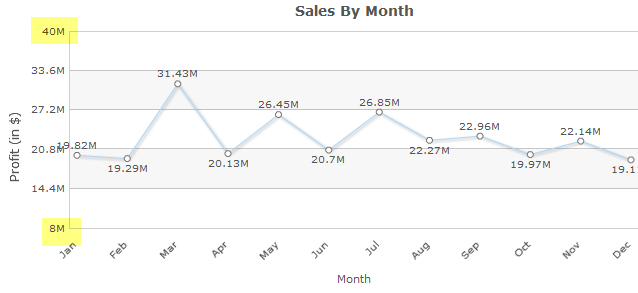
Add a label by typing a name in the X/Y Axis Label field. This will be the title for that label. In the above example, the X axis label is “Months”, and the Y label is “Total Sales (in $)”.
The font settings for the text of the label can be modified using these fields:
X/Y Axis Label Font
Available Fonts are Helvetica, Arial, Times New Roman, Tahoma, and Sans-Serif. Sans-Serif will make the font be whatever the browser’s default Sans-Serif font is.
X/Y Axis Label Font Style
This setting will make the font Bold, Italic, both, or normal. The default “Normal” will leave the text without bold or italics.
X/Y Axis Label Font Size
The font size can be raised or lowered here. By default it is set to 10 pt.
X/Y Axis Label Font Color
The font color may be a 6-digit hexadecimal value or any of the 17 HTML color names. You can also click on the color wheel next to the text field to pick a color from a palette.
X/Y Axis Label Margins
X Axis Item Label Tab
This tab gives options for the labels of each bar on the x axis of the chart:
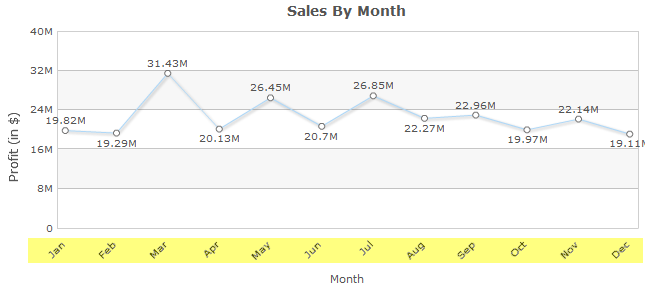
The angle of the labels can be modified by changing the X Axis Item Label Rotation. Units are in degrees. Perfectly horizontal is 0 degrees, perfectly vertical is 90 or 270 degrees.
The font of the labels may be edited with the Font, Style, Size, and Color settings. Explanations for each setting are noted above in reference to the X/Y Axis Label.
Y Axis Scale Tab
This tab deals with the numeric labels along the Y axis.
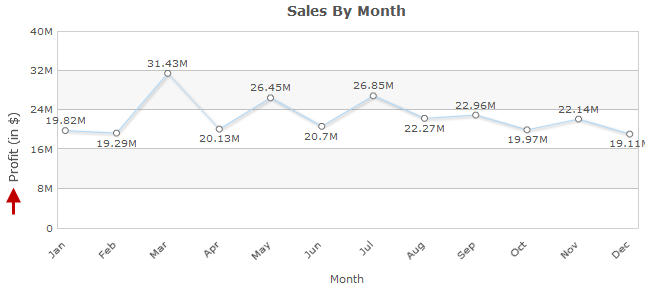
The font settings may be modified as noted above in the X/Y Axis Label Tabs.
By default, the Y-Axis scale lines are turned on. To turn them off, set Display Y Axis Grid Lines to “No”.
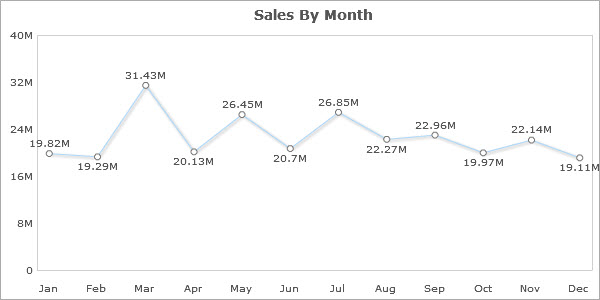
The next two values set the scale of the graph. When these are set to zero, the scale varies to match the values of the graph. To fix the upper and lower limit, enter the values into the Y Axis Upper/Lower Boundary. The example below is with the upper boundary set to 1,250,000,000 and the lower boundary set at 500,000,000.
The final value sets the distance between the scale markings on the graph. The example above has been set to 250,000,000 units of distance.