Conditional Calculations are a great tool to be able to customize your application and take them to the next level by adding if/else logic.
Examples
Some examples of conditional calculations could be:
- To control the color of individual data. For instance, you could divide data output into three different color groups: red (for low performing values), yellow (for mid-range values), and green (for high performing values).
- To control what options are available to a user. For instance, you wish to show an Update link when a field is equal to a certain value. Otherwise, show an Add link.
Conditional calculations allow you to not only create calculations, but also incorporate them into your output via m-Painter.
Using Conditional Calculations to Control Color
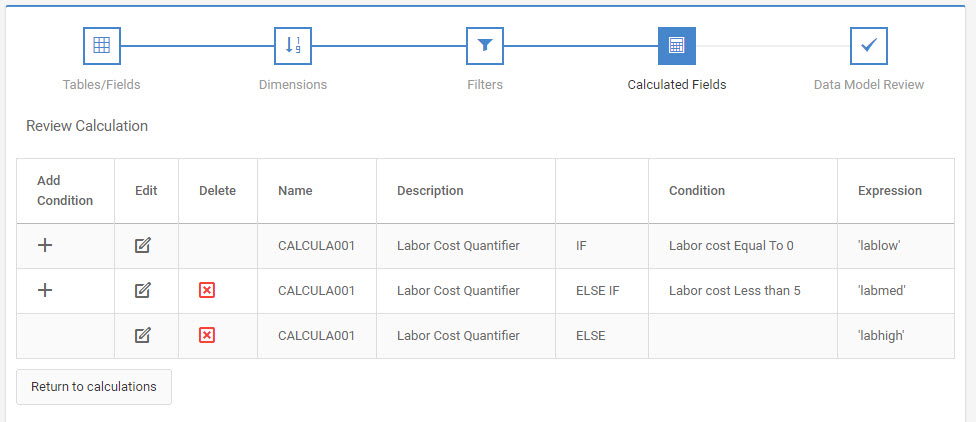
For the first example, we will examine how to use conditional calculations to modify the color of your result set based on the value of a field. To do this, we will use calculations as we did before. First, we need to decide how we are going to categorize the data. In this example, we will look at Labor Cost and divide them into three groups (0, 0 through 5, and greater than 5). The calculations will be set up as such, so that each calculation is equal to a specific CSS class name:
Build your application and open m-Painter. From the m-Painter toolbar go to View -> Source, and click the ‘CSS’ tab. In here, copy and paste this inline styling code into the CSS pane of your m-Painter source.
 .lablow { font-family:Verdana,Arial; font-size:8pt; color:#FF0000; background-color:#FFFFFF; border:1px solid #003121; }
 .labmed { font-family:Verdana,Arial; font-size:8pt; color:#FFFF00; background-color:#FFFFFF; border:1px solid #003121; }
 .labhigh { font-family:Verdana,Arial; font-size:8pt; color:#00FF00; background-color:#FFFFFF; border:1px solid #003121; }
Feel free to edit the above code as necessary, including removing or adding any custom CSS declarations. Above, all fonts are veranda, 8pt and share a background color of white. The difference is in the text color (lablow is red, labmed is yellow, and labhi is green).
The last step is to change the class name of your <td> tag to ${row.CALCULA001} so that when the application runs it will substitute CALCULA001 for the appropriate value (lablow, labmed, labhgh) and will then apply the appropriate inline style. Once done, your <td> tag should like like the following:
<td class="${row.CALCULA001?html}" align="left">
Using Conditional Calculations to Control Output
For the final example, let’s assume we are trying to dictate what text shows depending on a value in a report. Specifically, let’s say you are working with a report that sets budgets. If the budget has not been set (currently equals 0), you want the user to click a button that lets them add the record. However, if the value does not equal 0, you want users to be able to click a button that allows them to update the budget for that line. A basic approach would be to just display both links, but with conditional calculations, we can set the application up so it is “smart” enough to know what link to display.
In the Calculations screen, we will need to add two conditional calculations. What we will be doing is coding both hyperlinks into the application, but with the use of the CSS property “display”, we will hide the hyperlink that is not applicable. To do this, set up your calculations as noted below:
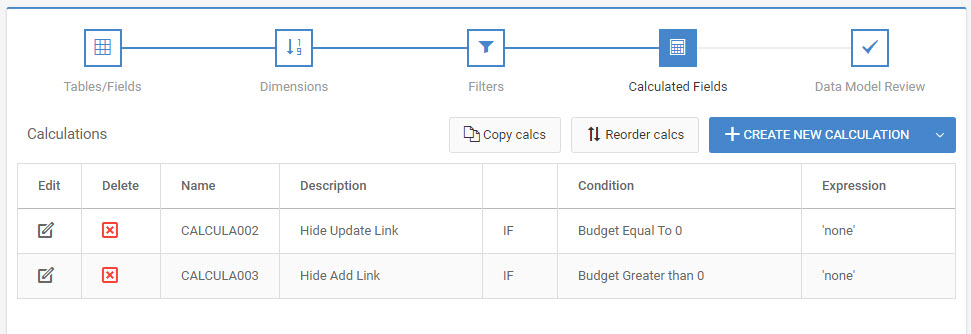
The rationale for setting up the calculations as noted above is that if the budget is not set to zero, we want the user to be able to update the record. Otherwise, if it is zero, the user will only be able to see the option to add the record. Setting the CSS property display to none hides the element from the page so only one of the links will be shown. When we code in m-Painter, we will add this style and calculation to the appropriate link.
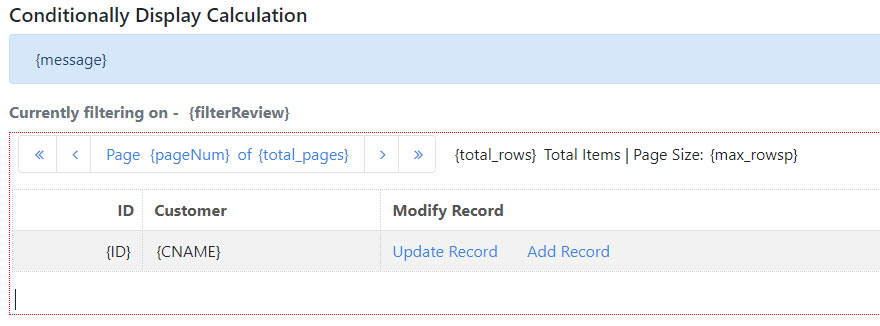
Compile your application and paint it so the two links are in the same column, as shown below:
As a reminder, your link to update a record should look similar to this:
LIBRARY.MXXXXXs?slnk=1&action_mode=UVK&FIELDNAME=${row.NAME}
While add mode should resemble this:
LIBRARY.MXXXXXs?slnk=1&action_mode=AVK&FIELDNAME=${row.NAME}
Once completed, right-click on the cell that contains these two links and select Cell » Edit Cell HTML. This will pull up the HTML for this cell, so we can add style="display:${row.CALCULA001?html};" to each link. Once completed, it should look like the screenshot below.
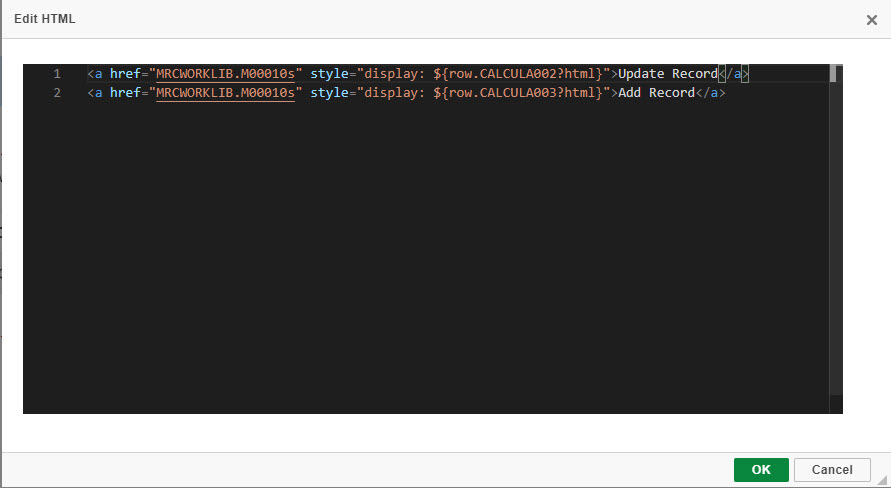
Notice how Calc 2 is applied to the “Update Record” link while Calc 3 is applied to the “Add Record” link.
Click OK and then save.
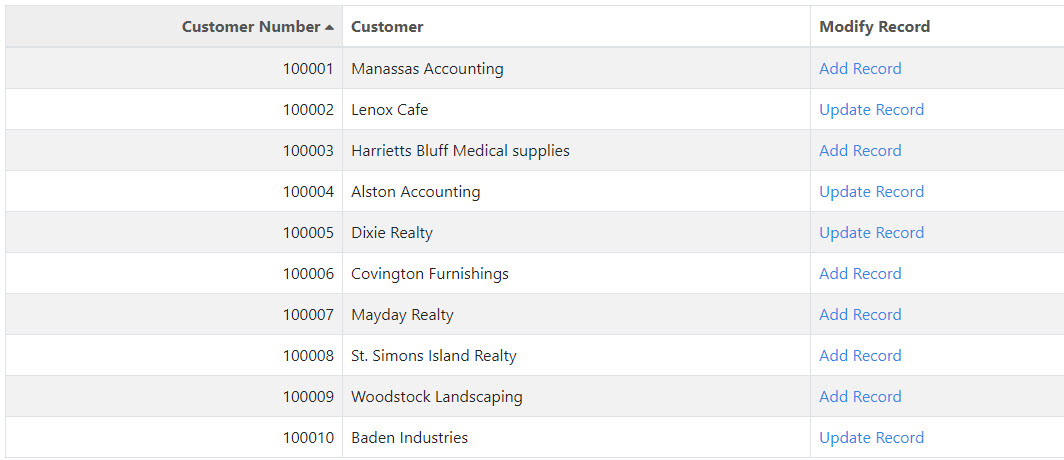
Run the app and your final result should look like this: