Overview
m-Power’s Page Break feature allows developers to separate data whenever a dimension key changes. This option is configured under the “Dimensions” screen within the “Data Model”.
Depending on the output type selected at run time, this feature behaves in two ways:
Print and PDF Outputs: When using PDF or Print Optimized HTML, a new printed page is issued every time the specified dimension key changes.
Excel Outputs: When using Normal Excel (13) or Formatted Excel (16), the data is automatically separated into individual, organized worksheet tabs for each dimension group.
Example
Let’s assume we want to create a report of all our salespeople, sorting on the Salesman Number. However, we would like all of our salespeople to be grouped by state, with each state either printed on a different page or placed on its own separate Excel tab.
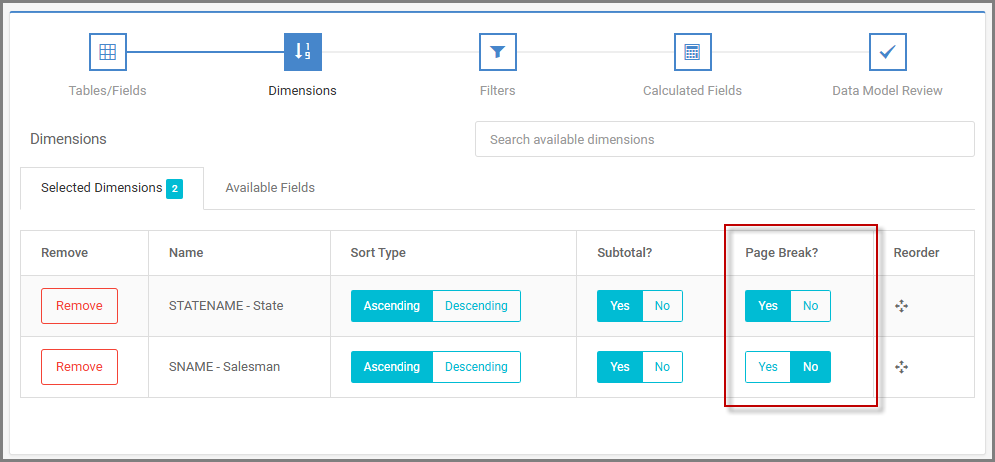
- Navigate to the Dimensions screen within your Data Model.
- Select ‘Yes’ on the “Page Break?” dropdown for the field on which you wish to page break (in this case, the State field).
Run Time
Depending on your chosen output format, the Page Break feature will structure your data accordingly:
Print & PDF Outputs
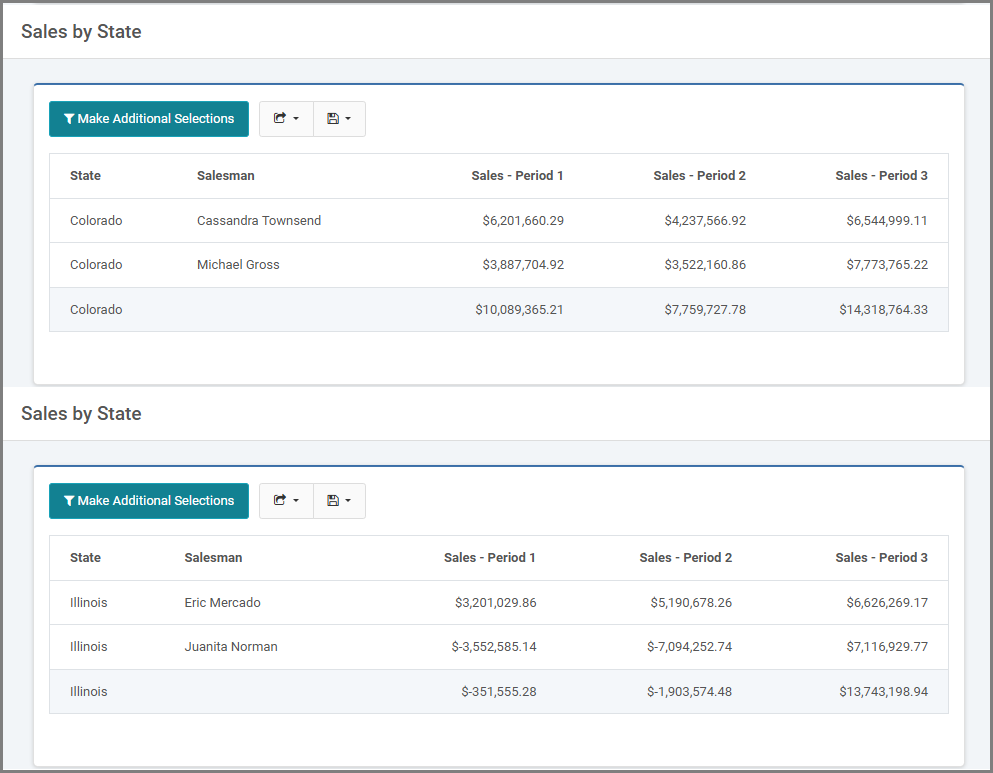
When viewing the report in the browser, you will notice the groupings—for example, Cassandra Townsend and Michael Gross of Colorado will be separated from all of the Illinois salespeople.
While m-Power places all of the data adjacent to each other on the screen without any spaces, this is not an accurate representation of the data as it will appear when it is printed on a page. When you select “Print,” your browser will know to send each subsection to the printer as its own distinct page.
Excel Outputs
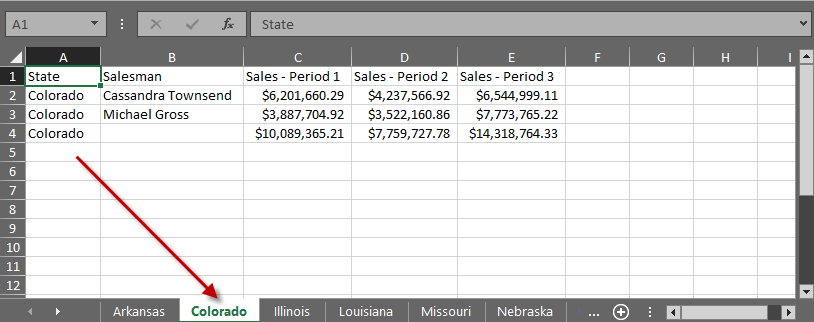
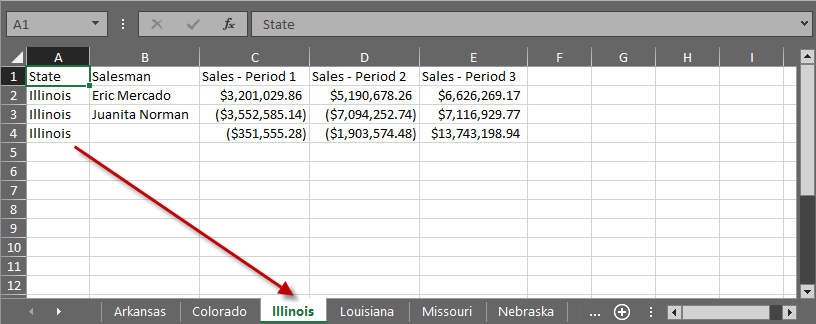
When exporting your report to Excel, the page break logic is applied directly to the workbook structure. Instead of downloading a single, continuous spreadsheet, m-Power dynamically generates a new worksheet tab for every dimension key change.
Following our example, your downloaded Excel file will automatically feature one tab dedicated to the Colorado salespeople, a second tab for the Illinois salespeople, and so on.
Notice how Cassandra Townsend and Michael Gross of Colorado are on a separate page from all of the Illinois salespeople.