The Pivot Table template was created to offer maximum flexibility while minimizing time needed for customization in the build process. The primary use of this template is to quickly total both column and row data, while grouping via one or more fields, in a completely ad-hoc environment.
Features that Apply to All m-Power Templates
Features that Apply to the Pivot Table Report Template
All Templates Features
m-Power templates allow you to retrieve rows of data from one or more database tables or database views. Utilizing SQL statements, m-Power connects to your database and allows you to access the data via a web application.
Back To Diagram
Ad Hoc Template Specific:
m-Power templates allow the end user to sort the data fetched from the database. Ascending or descending order can be controlled from the table heading by clicking the up or down arrows. To turn this feature on or off, access the application properties and select Yes or No for the advancedSort property.
Back To Diagram
Format Numeric Data:
m-Power templates allow developers to easily modify the numeric format of fields to better suit your needs, directly from the interface. An example of this can be the use of a comma at the thousand decimal point: (2,000) or the inclusion of decimal digits: (2,000.00) From the application menu, click Field Settings. For numeric fields you will see a Numeric Field Format column, use the drop down to select the numeric format you need.
Back To Diagram
Filter Via Record Selections:
Create hard-coded or user interactive filters based on specific criteria from your data. This feature allows users to filter the data to display only those records that match the selection criteria. Several options are available to create the relationship of the search, including “equal to, not equal to, is in the list, is in the range” and many more. Learn more.
Back To Diagram
Add Multi-Tenant Security:
m-Power applications can be secured to allow different users to access the same application, but see different results, based on the user login credentials. One example of this can be a report that contains records of customers for all the States in the USA, but the user will only work with the customers in his/her home State, via row level security m-Power can filter and display only the customers that the user is allowed to see. This technique allows you to fully implement scalable security solutions. Learn more.
Back To Diagram
Override/Customizable Error Messages:
All m-Power templates allow you to modify the default error messages. Most error messages are generic in describing the issue, maybe you need your users to see a more personalized or informative error message. From the application properties developers can change the error message without having to open the code source of the application. Learn more.
Back To Diagram
Add Drop-Down List or Lookup List to Text Input Fields:
Add a drop down list or lookup window to your application using m-Painter. These features will allow users to input data by selecting it from a list or lookup windows. This enhances the user experience, simplifies their tasks, and allow for less errors on data input. Learn more about Lookup Windows. Learn more about Dropdowns.
Back To Diagram
Add Calendar Widget to Date Inputs:
Using m-Painter developers can add a calendar picker next to a date input field. The date format in the calendar picker can be modified to match the format in the database. This feature will save users time and it will ensure that the date format entered is consistent with the database. Adding a calendar picker will make your application look and feel more professional. Learn more.
Back To Diagram
Call External Object Programs:
m-Power can handle your back-end business code too! The use of External Objects allows m-Power to tie into your custom coding easily, whether it is Java, SQL, or RPG. Learn more.
Back To Diagram
Saved Searches:
For end users running applications, there is a feature that allows them to save the search and come back to it later, saving them time and making it more efficient by saving multiple searches and switching between them with just a click. These searches can be found on the right upper corner of the running application by clicking Options then Saved Searches. Learn more.
Back To Diagram
Customize HTML with m-Painter:
m-Power ships with its own HTML editor. This tool, called m-Painter, allows you to modify the HTML code in a very easy way by using a WYSIWYG (What You See Is What You Get) editor, where all the graphical modifications are instantly visible. For the advance developers, there is a text editor mode too. You can access the HTML editor by clicking Presentation on the Application Menu. Learn more.
Back To Diagram
Control DB Join Type:
When joining tables you can set the join type of the application to be Left Outer Join or Inner Join. An inner join specifies that only records in the primary table with matching records in the secondary table will be displayed.
Back To Diagram
Add Row-Level Logical Fields:
m-Power allows you to create a logical field at the database level that is available to all applications. The options are Substring, Concatenation, or UDF (User Defined Function). By creating these files at the dictionary level, they are reusable across the entire dictionary, saving the developer time! Learn more.
Back To Diagram
Tablet & Mobile Output:
m-Power allows developers to create applications specifically for PC browser, Tablet, and Smartphone devices. For the user, this means that they can access the same report on their PC, tablet, and smartphone and see a completely different output on each that has been tailor-made for their device. For the developer, it means that they can create and maintain one single application that will create the proper output formats automatically. Learn more.
Back To Diagram
SmartLinks:
SmartLinks allow developers to easily link one application (Inquiry, Report, or Maintenance) to any other application, passing key data automatically. An example of this can be an Inquiry or a Report that links to a maintainer to update only an specific record and then redirect back to the list of records. By smartlinking applications m-Power makes it easy to link applications together to create smooth navigation between web applications. Learn more.
Back To Diagram
Pivot Table Report Features
The Pivot Table Report uses AJAX form submission to refresh data on the page. This populates data without refreshing the page, making the application run seamlessly when drilling down or making runtime selections.
Back To Diagram.
User Controlled Dimensions:
At runtime, end-users can select and swap row and column dimensions. These dimensions, which are sequence keys, are determined by the developer. This behavior is a key component of any Pivot Table.
Back To Diagram
Runtime Value Prompt Record Selections:
Instead of only supporting hard coding a value within a record selection, reports also support runtime value prompts. Runtime value prompts allow users to input a value at runtime, creating a dynamic data selection. Pivot Table reports support both the use of check boxes and radio buttons in conjunction with record selections.
Back To Diagram
Advanced Runtime Selections:
In an Pivot Table Report, record selections and report data are always displayed on a single page. In addition, these reports allow end-users to collapse both the entire selections bar, as well as individual record selections.
Back To Diagram
Drill Down Capabilities:
This template can be used to create drill down levels of data. This enables end-users to collapse and expand data as they see fit. Unlike other m-Power reports, the Pivot Table Report displays lower levels of data below higher levels of data, showing subtotal and grand-total levels before detail records.
Back To Diagram
Export Displayed Data to Excel:
At runtime, users can choose to export the data displayed on the screen to Excel format. This allows directly creating Excel files in the format the end-user desires, rather than the format chosen by the developer.
Back To Diagram
Group By Optimization:
A Pivot Table Report always uses group by within the SQL query. This improves performance by computing data on the database.
Back To Diagram
Runtime Graph Options:
Pivot Table applications automatically create multiple graph types representing the same data, increasing runtime flexibility. Moreover, users have the ability to limit the data seen within the graph with a built-in ‘Selection’ dropdown. This dropdown is populated by the values existing in the first row dimension.
Back To Diagram
Smart Selections:
As end-users enter Record Selection values, the report will filter out non-matching records to alert the user what record selection values are still applicable. For instance, if the end-user selects the first financial quarter of the year, months April to December will become grey.
Back to Diagram
Template Notes
Application Settings
Program Name: This will be the application’s number. By default m-Power uses the letter R (Report) followed by a five digits number. This number is automatically incremented by 10, but can be manually changed.
Note: the number must be unique in the Data Dictionary.
Select Only Matching Records: When joining to other tables, you have the option to create a Left Outer Join or and Inner Join. Selecting Yes (inner join) will include only matching records from the joined table. A simple example of this could be a Sales History table that links to a Product Master table. Now imagine some products have been discontinued and subsequently removed from the Product Master table. With an outer join, the discontinued products will still be reported. However, with an inner join, records without matching records in the product master will be omitted from the result set.
Summary or Detail Report: A Pivot Table Report always uses group by within the SQL query–therefore this setting can be ignored.
Template: You can select a template by scrolling through the available templates. The templates define the general layout and functionality of the resulting application. This section will list all the available report templates; you will see a small screenshot of what that template looks like at runtime. Learn more about templates.
Data Selection
Here you will see/modify the primary table you have selected for your application. Here you can create or modify joins to other tables as well.
Sequencing
Here you can select the field that your application will sequence by; you can have multiple sequence fields. You can re-order the sequences to fit your application’s needs.
Special Notes On Sequencing in Pivot Table Applications
- Within the report, one or more numeric fields must not be sequenced. These fields will be used within the dataset or graph.
- Fields that have been selected as sequence keys will appear as dimensions at runtime. These fields will not be totaled within the dataset or graph.
- While a Pivot Table will function correctly with just one sequence field, the true power of the Pivot Table is in using numerous sequence fields. The more sequence fields selected, the more row and column dimensions end-users will have to select from at runtime.
- By default, m-Power will automatically add one numeric field to the dataset and graph. This will always be the first numeric field listed in Field Settings that is not a sequence field.
- By default, m-Power will automatically add the first sequence field to the row dimension. If a second sequence field exists, it will be added to the column dimension. At runtime, end-users can select all other sequence fields for inclusion in either dimension.
Learn more about general sequencing.
Field Settings
Here you will find the settings for all the fields in the application. The options are:
Note: Deleting a field will remove the field from the application only, the table will be unchanged.
Field Name: This is the same name the field has in the table.
Table: The name of the table where that field exists.
Field Description: This is the text that will appear in the column header for that field, you can modify this field to suit your needs. This field will populate with the field description from the table by default, but it can be customized at the application level.
Display: A radio button allows developers to display or hide the field from the output page. There may be situations where a field is needed for calculation purposes, but the field does not need to be displayed at runtime.
Length: Here you can modify the length of the field. m-Power will only allow developers to shorten the length of the field, shortening a fields length will truncate its data. For example, if a field is 10 alpha and it is changed to 5 alpha, now only the first 5 characters will be displayed. The same principle applies to a numeric field, if a numeric field is 8 digits long; changing it to 4 digits long will only display the first 4 digits, and leave out the rest of digits.
Decimals: For numeric fields, you can modify the amount of decimal digits. A numeric field will have the option of changing its decimal length, alpha fields does not have a decimal option, developers can use this as an indicator to check if a field is a numeric or character type.
Numeric Format Code: For numeric fields, you can modify the way the numbers will display, this includes displaying decimals or not, how to display negative numbers, etc. Multiple formats are built in for developers to use, shall you need a different format code, m-Power allows developers to create their own User Defined Format codes; these codes will add logic for common types of fields such as: Currency, Time, or Dates. Accessing the User Defined Format Codes from the Admin section will also allow developers to modify current codes. Learn more.
Note: Do not confuse the User Defined Format Code with the User Defined Functions (UDF). The latter is a feature that allows developers to create or incorporate programing functions into m-Power. Learn more about UDFs.
User def: This feature has being deprecated
Record Selections
Record Selections can be created over fields from both primary as well as secondary tables. These are the options:
Relation: A drop down allows you to select a relationship for the filter. Note the relationship criteria ‘Select at Runtime’ is not supported in this template.
Value: This is the value to compare against. The options are:
Constant Value: A constant value allows you to hard-code any given value into a selection. This value cannot be modified by the end-user at run–time.
Application Field Value: Developers have the option of comparing a value from one field to a value from another field within the same record.
Runtime Value Prompt: This option will create an input within the HTML that will allow users to input a value for the record selection at runtime. Runtime value prompts allow users select data specific to their individual needs.
And/Or: When creating multiple record selections, you have the option to set them as “and” or “or” Example: selection A “and” selection B will display only records that match both selections. Selection A “or” selection B will display records that match one or both selections. Learn more.
Calculations
Calculations are a very powerful feature of m-Power; with calculations, developers can create logical fields that will apply to the current application only. This can be used to include SQL code in a field, such as cast a numeric field as character, create date conversions, inserting the current date and time, and much more. Learn more.
External Objects
This feature allows developers to connect m-Power application with their current business logic, or to extend m-Power capabilities by allowing developers to write their own Java, RPG, or SQL programs, and integrating these programs into the applications. m-Power utilizes “locations” to connect the external objects, these locations vary depending on what the external object does and when it should be executed. The following locations are supported in this template: Learn more
*JREADRECRD This location will call the external object after each record is processed.
*ADVRECSEC This location has been deprecated. Learn more about Row Level security.
*STRSEARCH This location has been deprecated.
*STRUPBDFT This location has been deprecated.
*SELECT This location has been deprecated. Learn more about creating dropdown lists using m-Painter.
*RUNVALID This location is used to validate prompt inputs.
SmartLinks
SmartLinks are not supported in the Pivot Table template.
Note: After performing any changes in the above sections, the application must be recompiled for the changes to load. If the changes are to be displayed at runtime, then the Presentation Layer code (HTML) must be overwritten when recompiling the application.
Template In-Action
Application Properties
When accessing the Application Properties, a window will slide open with several tabs; let’s go through each of the tabs:
Web Parameters
Margin Calculations
While Pivot Tables are easy to use, one common question the helpdesk receives is “How can I add runtime calculations to my subtotal and grand total levels in a Pivot Table?” This can be done through the use of margin calculations. We will use a Pivot Table report that evaluates sales per customer by year as an example. The image below displays the data table for this report.
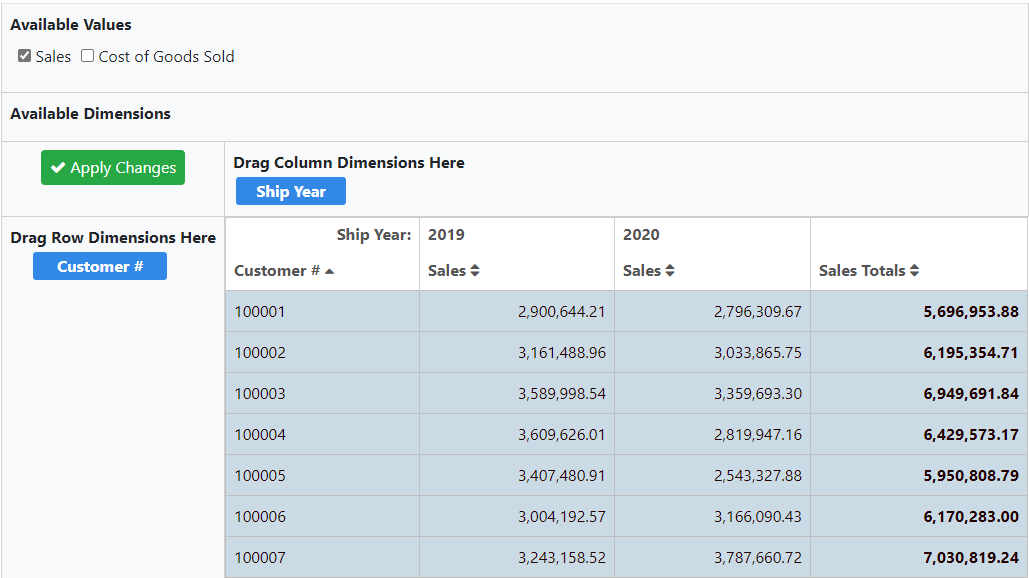
As you can see, we are examining the sales, in dollars, per year for each customer. Now, we want to view the cost of goods sold as a percentage of sales. To do so, we would set up the following calculation.
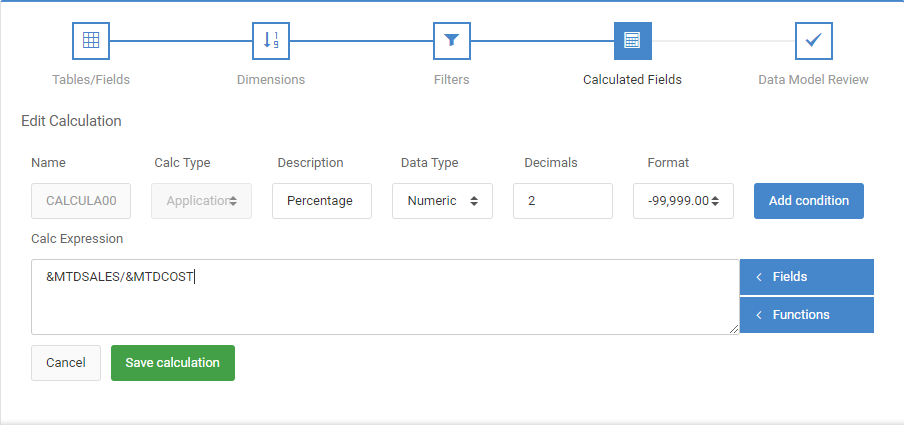
Note that the calculation is set to be an application-type calculation. After recompiling the application, the calculation ‘Percentage’ has been added as a dimension to my Pivot Table.
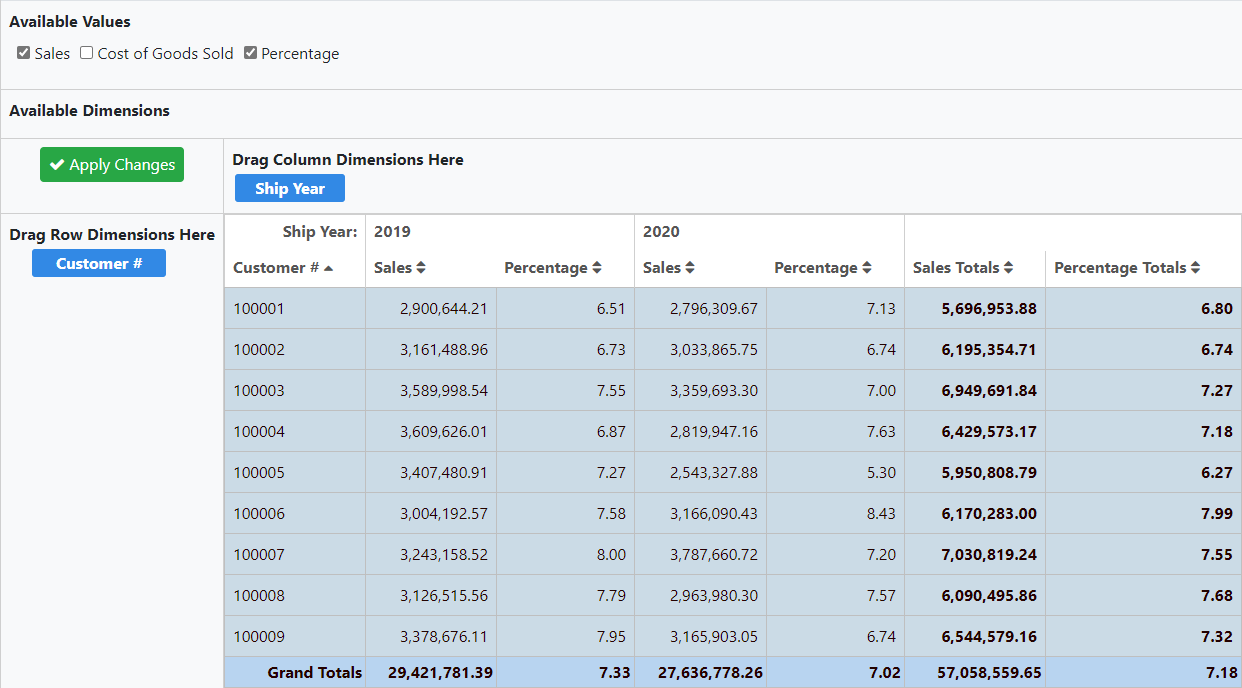
My margin calculation is now complete, and the Pivot Table shows the cost of goods sold as a percentage of sales.
Converting Graphing Logic Types for Pivot Table Reports
To convert your graphs to utilize jFreechart logic instead of Fusion graphing logic, open application properties and navigate to the graph tab. The graphLibrary property should be set to “Fusion Charts”, if already using Fusion graphing logic. Change this value to “jFreeCharts” and click accept. Then open m-Painter, and Toggle to the source view. Search for the text ‘graphType =’. Delete this entire line. Save this, and now your application should be set to use jFreecharts.
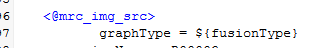
To convert your existing jFreecharts to use Fusion graphing logic, open application properties and navigate to the graph tab. The graphLibrary property should be set to “jFreeCharts”, if already using jFree graphing logic. Change this value to “Fusion Charts” and click accept. Then open m-Painter, and toggle to the source view. Search for ‘<@mrc_img_src>’. If your application is a Pivot Table, add a new line containing the text ‘graphType = ${fusionType}’ directly under <@mrc_img_src>. The edited HTML code should appear like so: