The AI Charting Assistant makes it easy to build charts by simply describing what you want to see. Whether you need a bar chart, line chart, or something more complex, the assistant turns your description into a working chart within your application. It saves time by handling much of the setup for you—making it faster and easier to visualize your data without manually configuring every detail.
How to Use
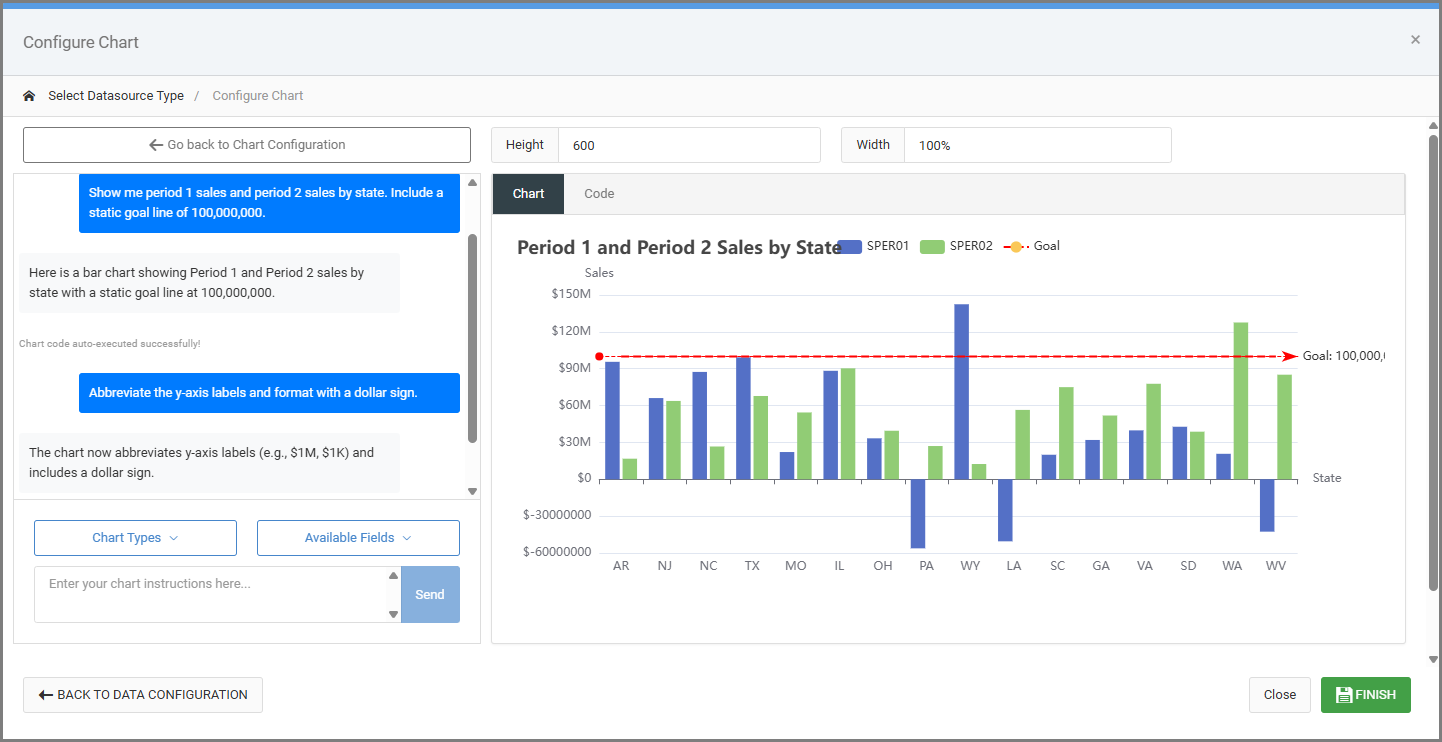
After inserting a chart into your application or dashboard, select the dataset for the chart as usual. When the Charting Wizard opens, you’ll see the option to use the standard wizard or switch to the AI Charting Assistant. Simply describe how you want your chart to look and behave.
You can choose a chart type from the dropdown or just tell the assistant which type you want. You can also select fields to chart or group by from the Available Fields list—or mention them directly in your prompt.
Once you’ve provided your charting instructions, click Send, and the assistant will generate the appropriate code, display a preview, and let you continue refining the chart through conversation.
Note About AI-Generated Charts
The charts created by the AI Charting Assistant are generated using artificial intelligence. While this feature can save time and simplify chart creation, the results may not always be perfect or apply to every situation. Use your discretion when applying suggestions, and contact mrc Support if you have questions, need clarification, or experience technical issues.