Overview
This documentation will cover the Data List feature in m-Painter and explain how to utilize this feature within the presentation of your application.
The purpose of the Data List feature is to retrieve and render data from an external application or data model. The Data List feature will be applied to a presentation element (a button, card, table row, etc.) within the current application and will repeat said element for each record found in a retrieved data set.
A few real-world examples of this feature include:
- Displaying a list of orders on a customer dashboard.
- Replacing the stock table output in a Multiple Row Data List retrieval with a repeated card element for each record in the current application.
The example in this documentation will use a customer dashboard application, which within the current presentation a developer wants to query and display the orders for each customer, all within one application.
Key Terms
In this documentation, certain keywords or expressions will be frequently repeated. For clarification, those terms are defined here:
data list – A presentation element that renders on a per record basis based on the information returned in an external data source.
data source – A general term, which in the context of this document will reference the external data set the data list element looks up. The data source most often will be either an m-Power retrieval application or a Data Model.
Data Model – A pre-built data set that queries database tables/fields.
Implementation
The Data List feature, is accessible via two places, both within the UI and Data Options section of m-Painter. Regardless of which option selected the end result produces the same functionality.
Option 1 – Transform existing element into a data list
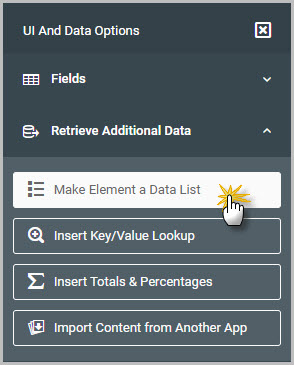
UI and Data Options -> Retrieve Additional Data -> Make Element a Data List.
This option is used when an existing element inside of the current presentation (such as a card or button) will be turned into a data list.
Any element in the presentation may be turned into a data list.
For each record found in the data list, said element will be repeated at runtime.
Option 2 – Insert component and transform into a data list
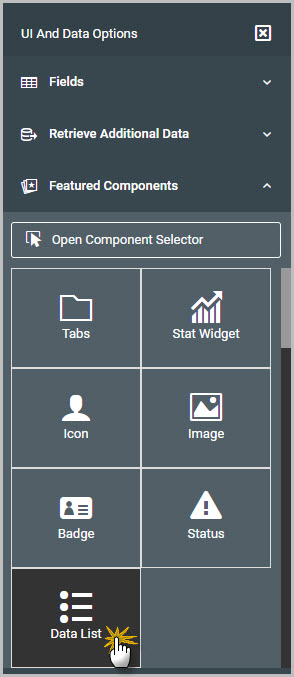
UI and Data Options -> Featured Components -> Data List.
Contrary to the above option, this is used when wanting to insert an m-Power component into the presentation and simultaneously turn said component into a data list.
For each record found in the data list, said component will be repeated at runtime.
Walkthrough
Example application
The Data List feature will be explained via an example application. Below is a Single Row retrieval application called “Customer Dashboard” with the stock presentation cleared.
After the layout was cleared, a card (left side) and a tab component (right side) were inserted into the presentation:
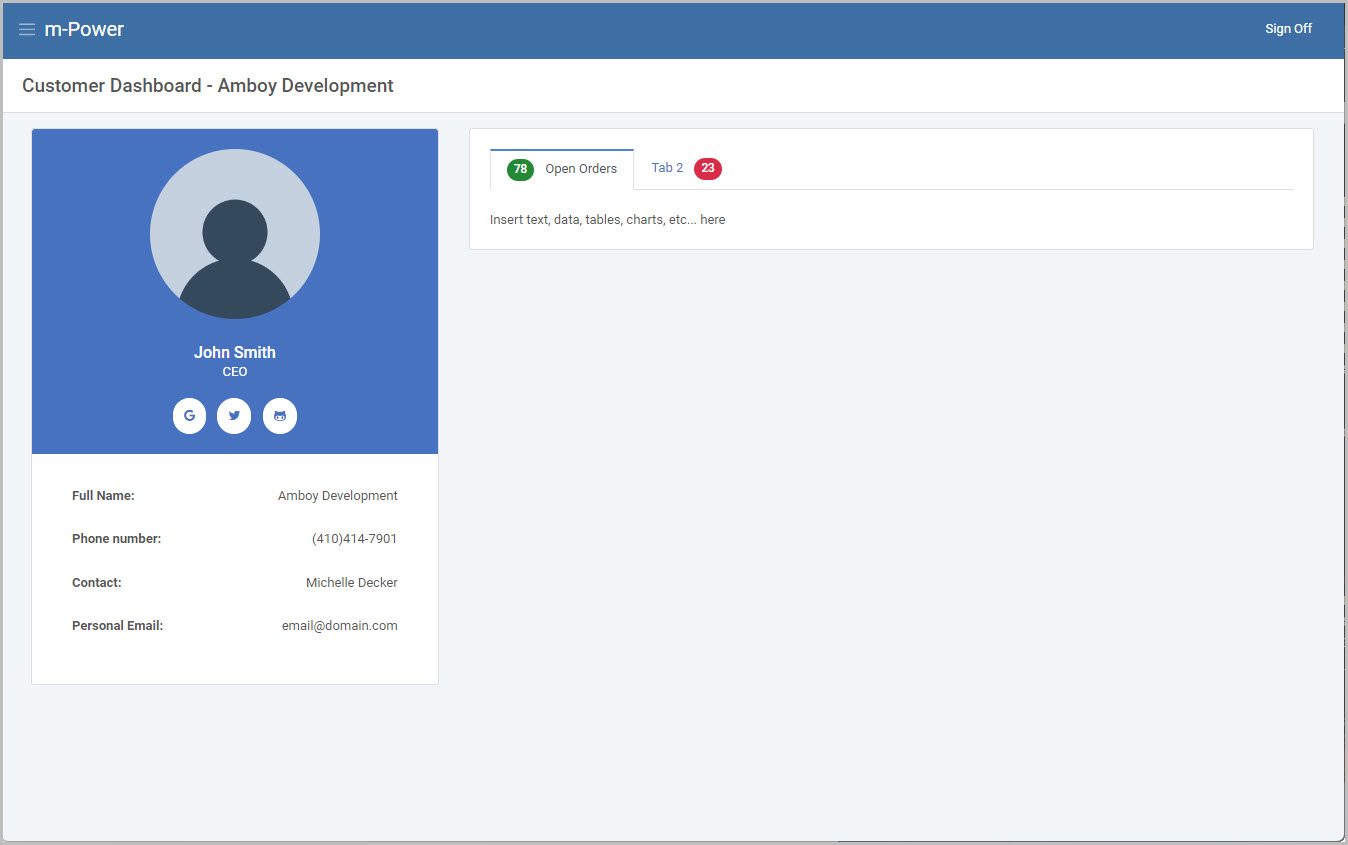
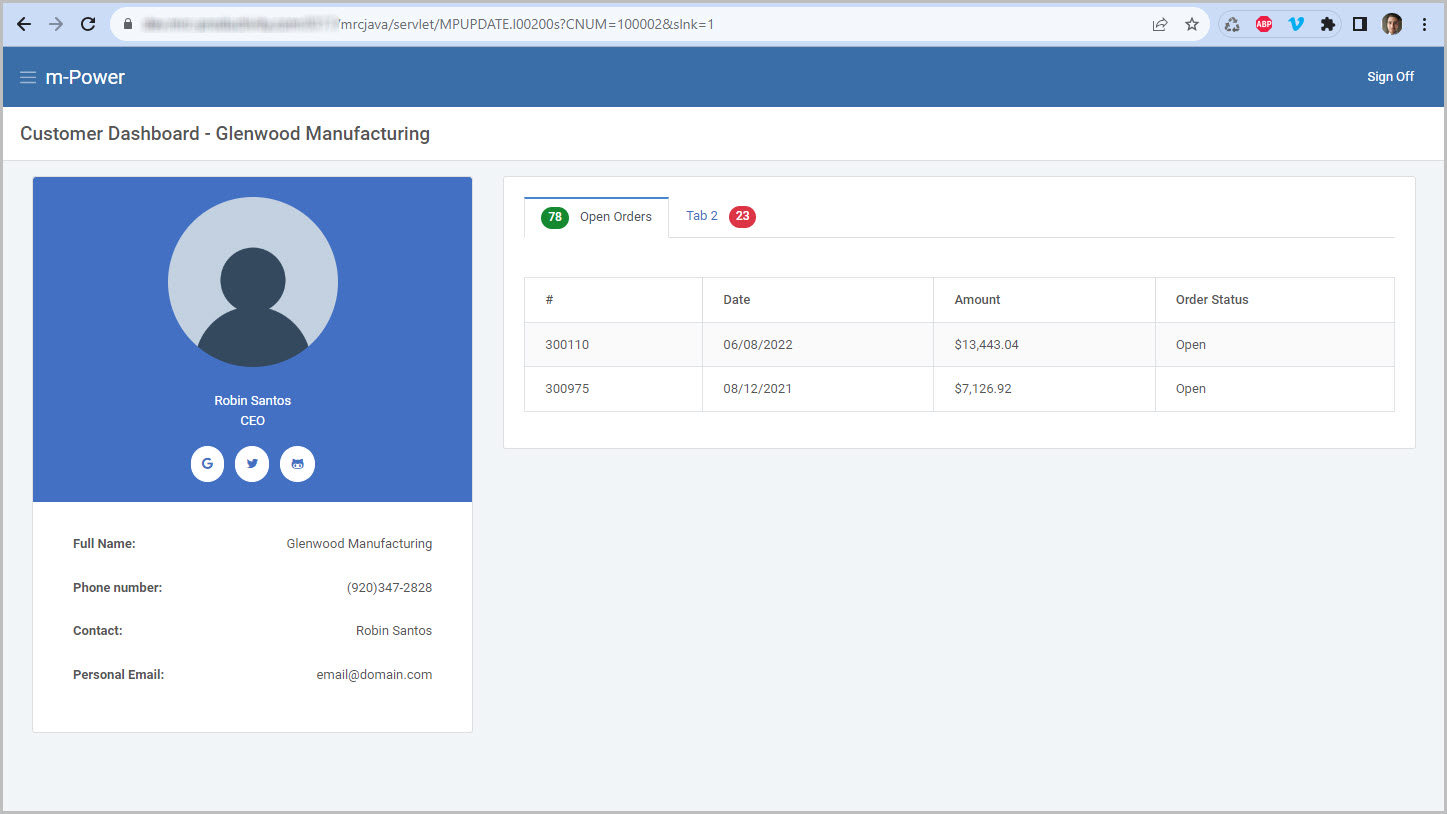
Using Figure 3 as a reference, the idea is in addition to showing the customer information on the left hand side, the first tab on the right hand side (that says “Open Orders”) will be utilized to show the customer’s current open orders.
This Customer Dashboard retrieval is only built over the customer information: Therefore the app’s very own data set does not contain any order information. Using the Data List feature, I can query and retrieve any customer’s order information from a separate application (or dictionary data model) and render that anywhere inside of this customer dashboard application.
Step 1. Inserting a component (as a data list)
First, the stock text in the tab will be removed (Figure 4).
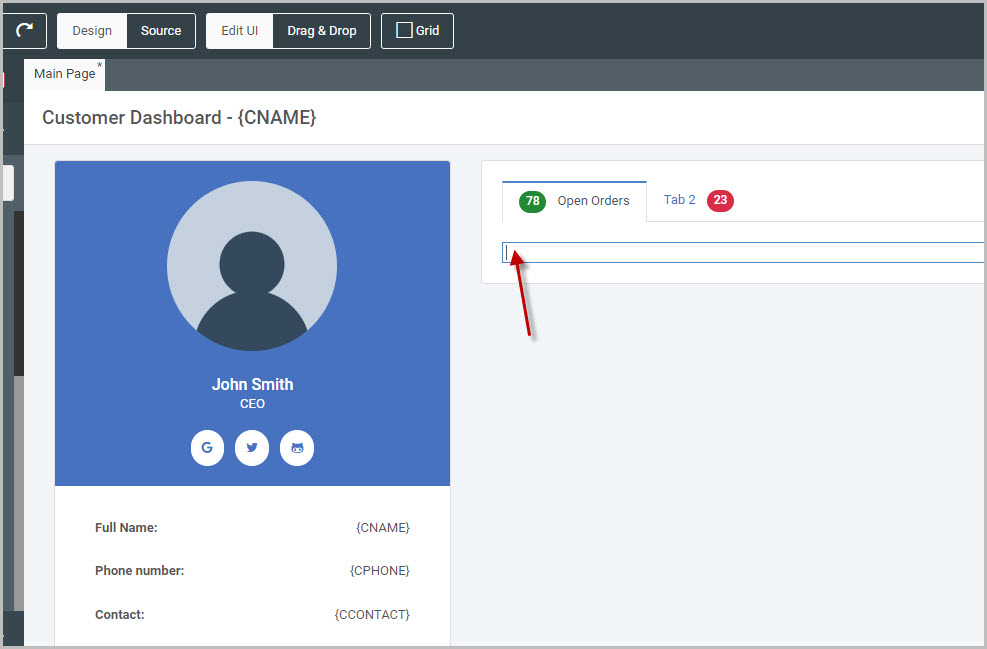
Where the cursor is, select from the UI and Data Options panel -> Featured Components -> Data List (see Figure 2).
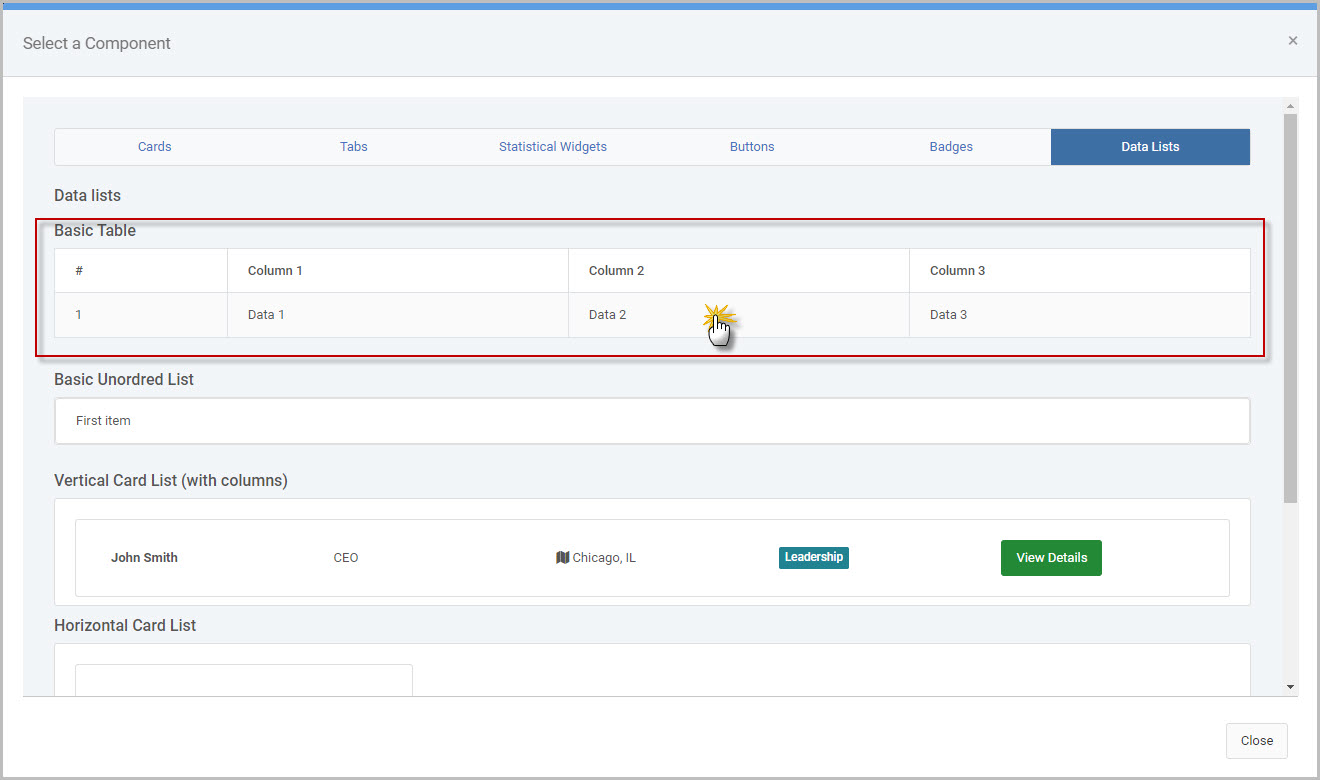
The window that appears will open the “Select a Component” window, with the “Data Lists” tab selected by default. Within this tab, select the desired component to bring into the existing presentation.
In this example, I’ll select the Basic Table (Figure 5).
Once chosen, the selected component (in this example a table) is simply brought into the presentation where the cursor was, as shown in Figure 6.
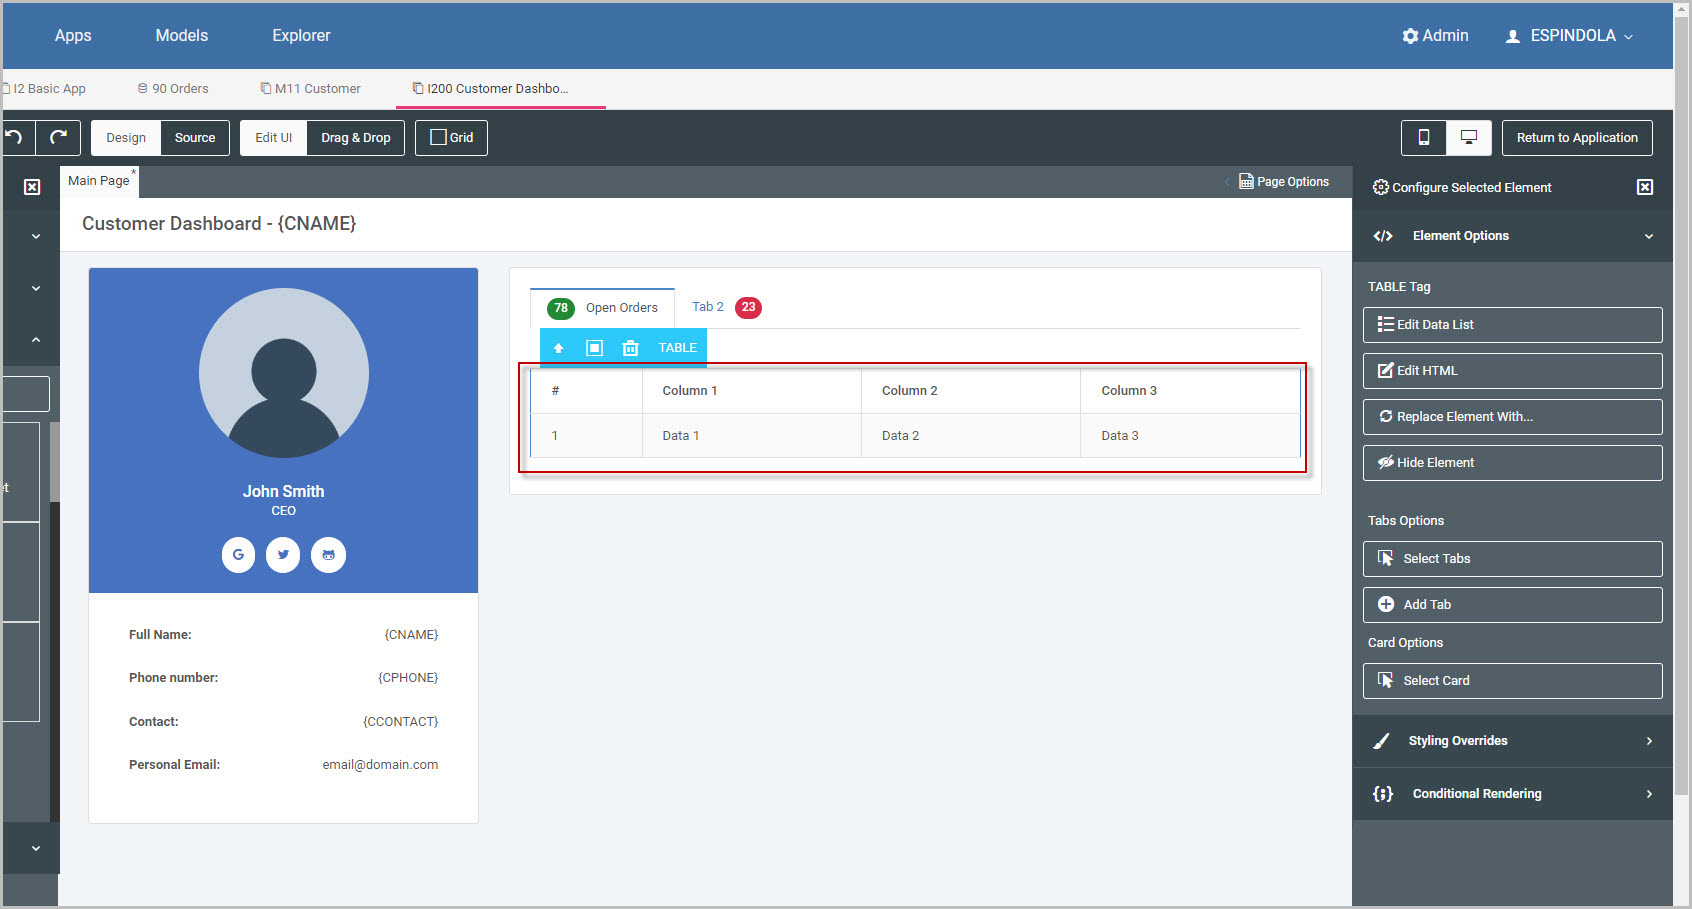
At the moment, the table does not contain order specific data. To this point, there is stock text that is placed within the header and table cells (ex. “Column 1”, “Data 1”). In the next section, I will separately query the orders dataset information that will render inside the table.
Step 2. Looking up the data source
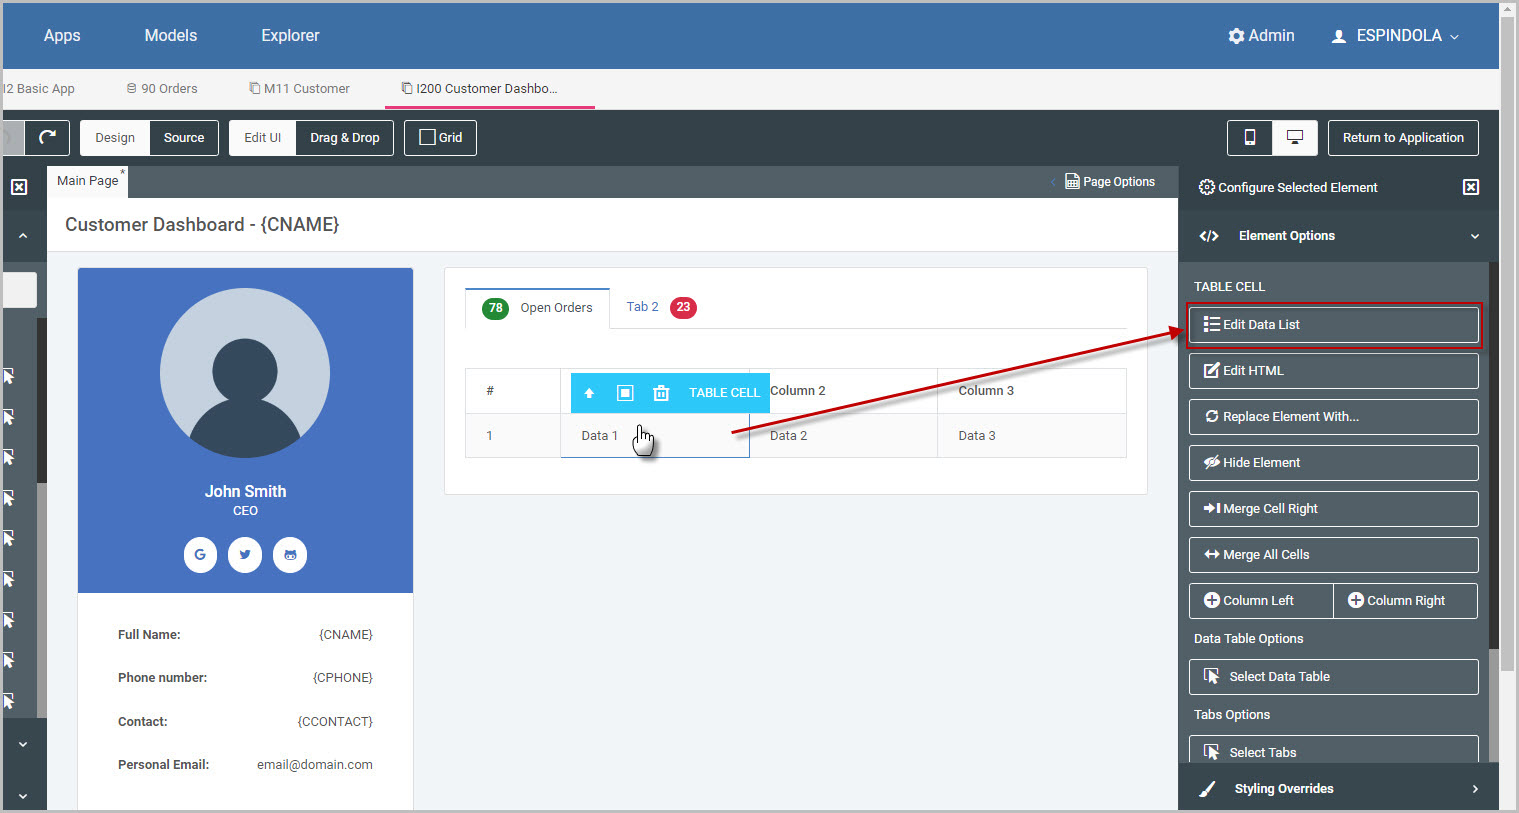
With the table inserted, now the appropriate data source must be tied to it.
m-Power will recognize the inserted component, in this case the table, is specifically a data list from Step 1. Because of this, when selecting anywhere inside that table (for example inside a table cell) m-Painter will bring up the Edit Data List button in the Configured Selected Element panel.
Click this option (Figure 7).
From this window that appears, the desired data source to obtain the data will be selected (Figure 8). Options include:
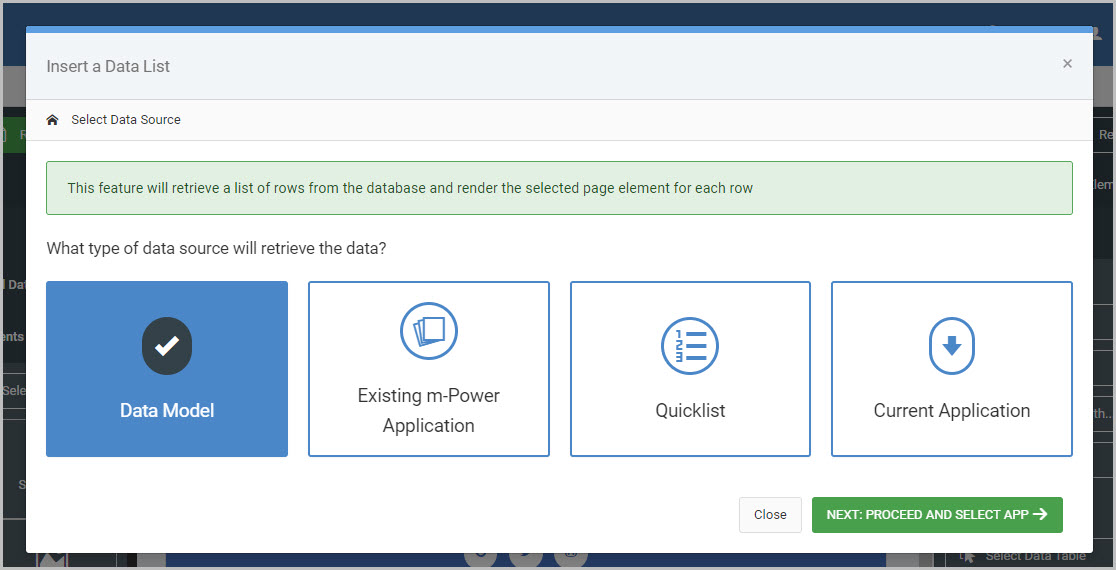
- Data Model
- m-Power application (retrievals only)
- Quicklist
- Current application
In this example, a pre-built Data Model over the order information I have already built (Data Model #90) and will select that model.
When configuring the selected data source, it’s important to pass any necessary parameters to filter the model’s returned data. In the scope of my customer dashboard retrieval, I only want to return orders for the currently selected customer in the dashboard.
Therefore in Figure 9, the customer number is mapped from the Data Model (left-side) dropdown current retrieval application (right side dropdown).
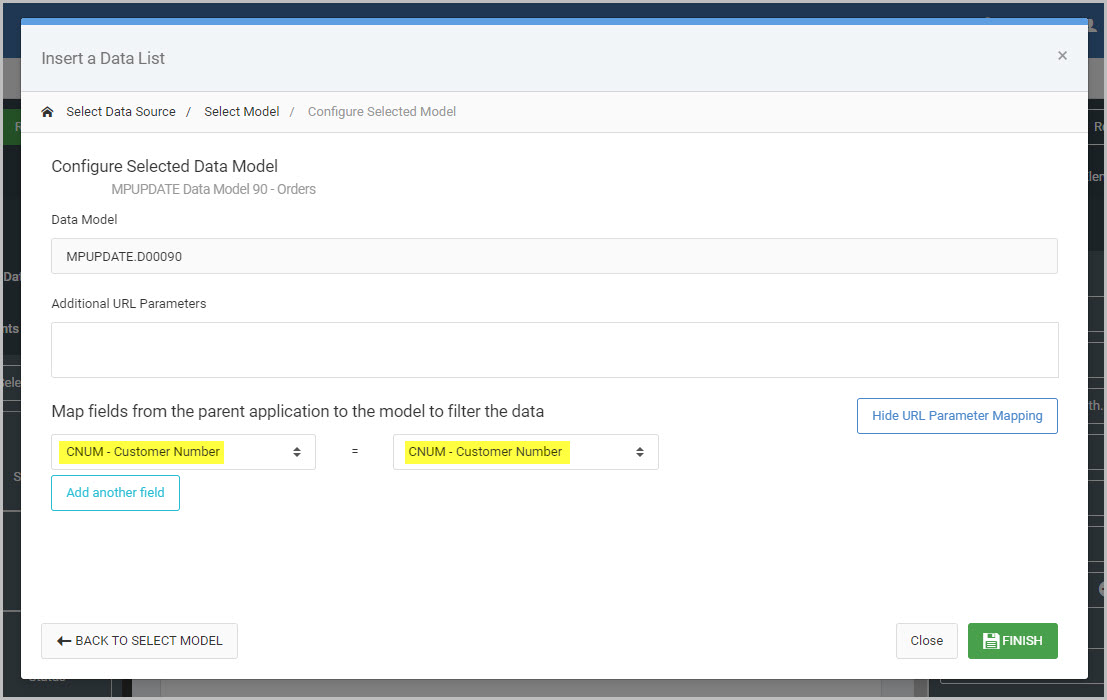
Once done, I’ll press Finish.
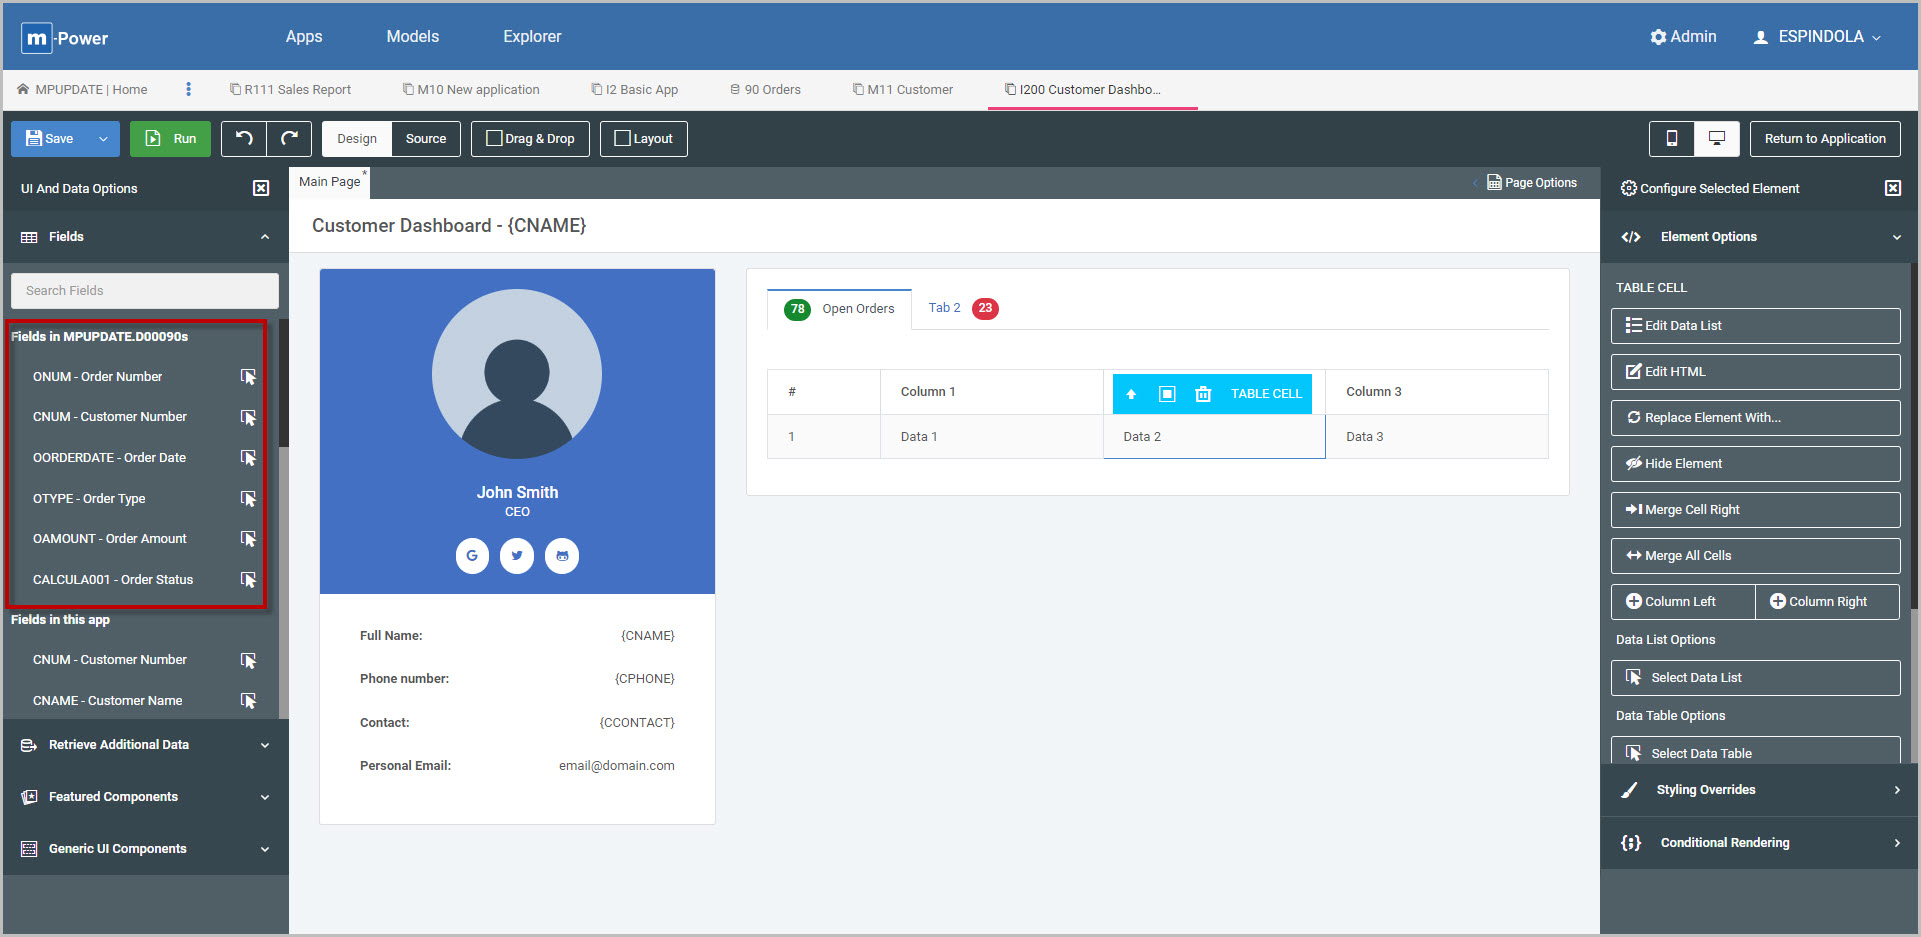
Step 3 – Inserting fields from the data source
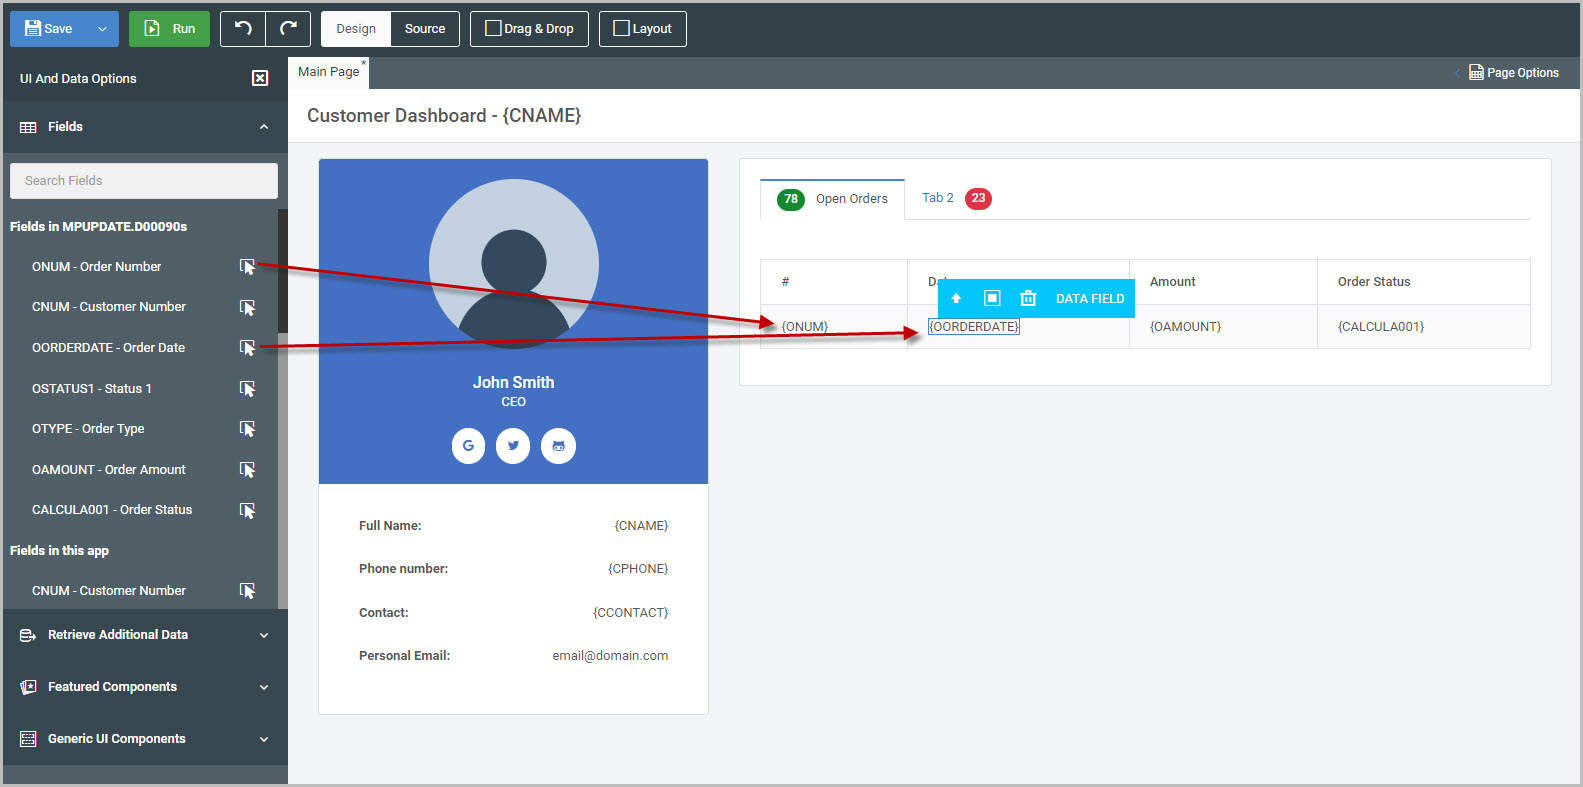
Once the data source has been queried in Step 2, nothing will immediately change within the current presentation. Rather, m-Painter will list the all the fields founds within that looked up data source, specifically in the Fields section of the UI and Data Options panel (Figure 10).
These fields must now be inserted into the current presentation, specifically into my table.
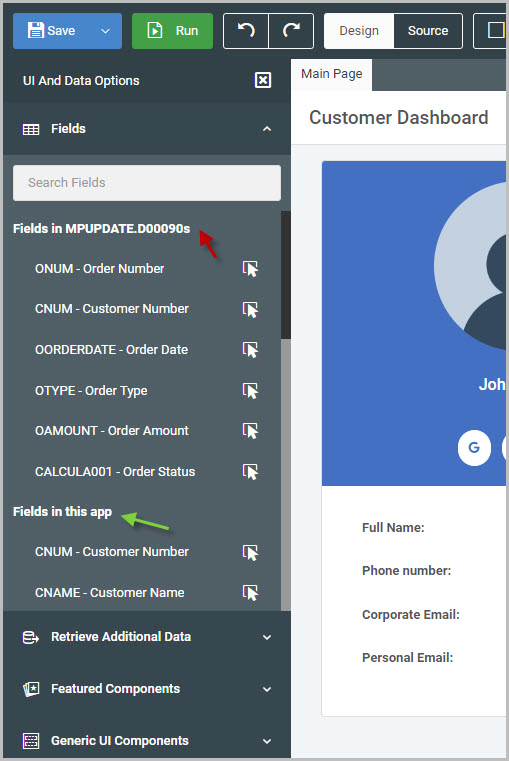
A closer examination in Figure 11 will show that m-Painter will distinguish between fields from the looked up data source versus fields in the current application.
It must be noted that fields from the looked up data source may only be inserted inside the original element that was converted to a data list.
I’ll simply insert any fields into the appropriate cells of my table and change the appropriate text in the header row above the cells.
After inserting my fields, I’ll save m-Painter and run the application.
Step 4. Runtime (final result)
At runtime, the data list element has been repeated (the table row) for each record returned from the looked up data source.
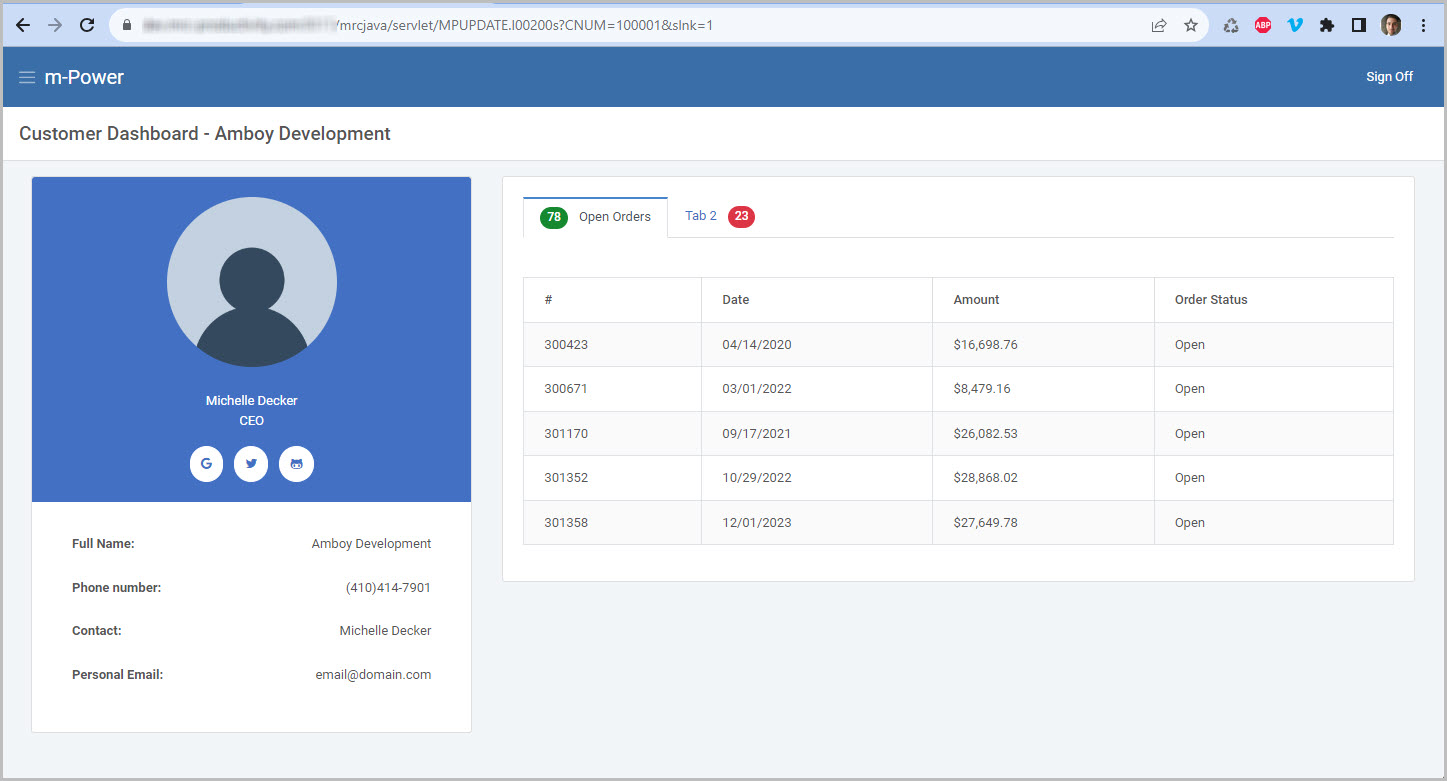
Attempting to load a different customer in the dashboard appropriately shows me that one customer’s orders: