
February 2014 · Oak Brook, IL
Today, software tool developer mrc announces the release of improved graphing and charting capabilities within m-Power. m-Power is software that rapidly creates web applications such as report-writing, Business Intelligence, executive dashboards, e-commerce, customer portals, and mobile applications, to name a few.
While m-Power already offered advanced charting features (chart drill-downs, tooltips, chart exporting and printing, mobile charting capabilities, and more), this latest enhancement gives m-Power's reporting and Business Intelligence capabilities a major boost. With this update, m-Power users can now:
Create better looking reports and dashboards
The new, animated charts and graphs give m-Power applications a smoother, more attractive look and feel. Combined with m-Power's point-and-click graphing interface, users can create attractive reports and dashboards in minutes.
Create additional application types
m-Power now comes with a comprehensive collection of charts and graphs, offering over 90 options. This opens the door to a far wider array of future m-Power templates and lets m-Power users create additional application types, such as:
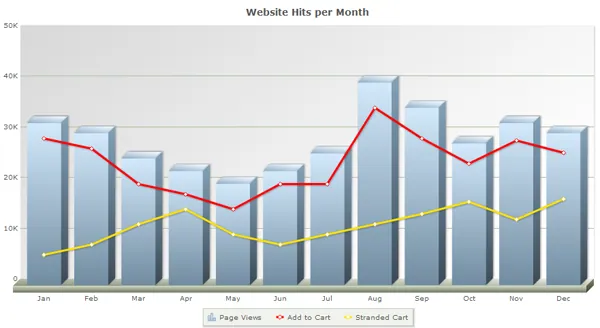
Multi-line and bar combo graph
As illustrated in Figure 1, this graph combines two or more chart types into a single chart. It helps users compare different sets of data from within the same chart.
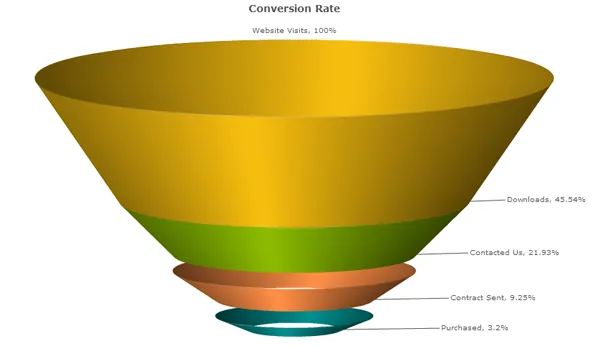
Interactive funnel chart applications
As illustrated in Figure 2, these charts help companies track areas like website conversion rates, sales cycles, and more.
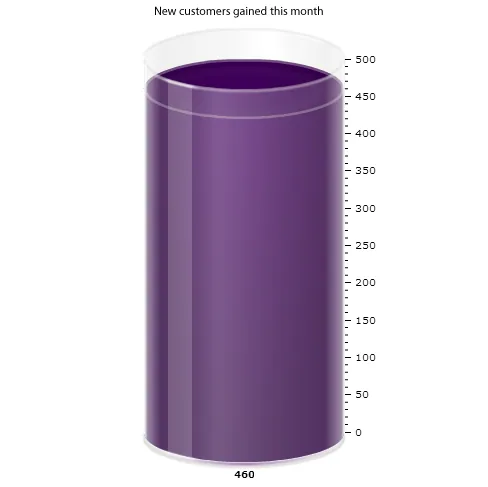
Cylinder charts
As illustrated in Figure 3, these charts are useful for tracking key performance indicators, as well as progress toward a specific business goal.
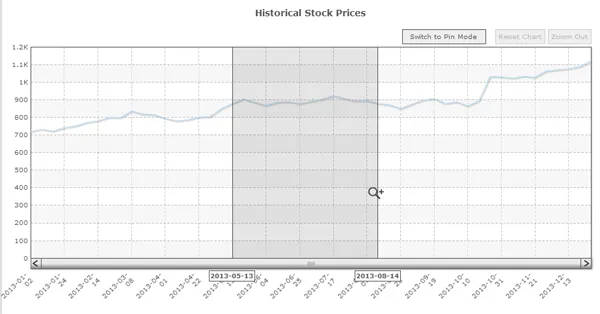
Zoom line chart applications
As illustrated in Figure 4, this line chart starts with a high-level view of data and lets users zoom into select areas on the chart to view detailed data.
And much more.
Easily customize their charts and graphs
m-Power's new graphing features come with a wider array of customization options, giving users more control over the look and feel, as well as the information displayed on each chart. Combined with m-Power's point-and-click graphing interface, m-Power users can develop and customize their charts more easily than ever.
"These new charts and graphs really improve m-Power's reporting power," says Tyler Wassell, mrc's Manager of Software Development. "Not only can users create a wider array of beautiful charts and graphs, they also have even more customization options than ever before."
###
Media contact:
Steve Hansen
Marketing Director, Michaels, Ross & Cole, Ltd.
Phone: 630.916.0662 x131
Email: mrc@mrc-productivity.com
About mrc
Michaels, Ross & Cole, Ltd. (mrc) is the creator of m-Power, a low-code development platform that lets organizations build custom web applications, reports, dashboards, portals, and workflows directly over their existing databases and systems.
With flexible deployment options (on-premises or cloud), perpetual licensing options, and unlimited users, m-Power helps IT teams deliver secure, tailored business software without vendor lock-in.