
July 2014 · Oak Brook, IL
Today, software developer mrc announces improved interactive reporting within m-Power. m-Power is a web application development platform that businesses use across their organizations. It creates web applications such as report-writing, Business Intelligence, executive dashboards, customer portals, and mobile applications to name a few.
Used for Business Intelligence (BI), interactive reports let users analyze large amounts of data. They provide users with a high-level view of their data, and lets them drill down, filter, and sort their data as needed. Interactive reports are great BI tools because they let end users analyze their data from any angle.
This new enhancement brings improvements to the already-popular interactive report. Now, m-Power users can:
Adjust row dimensions
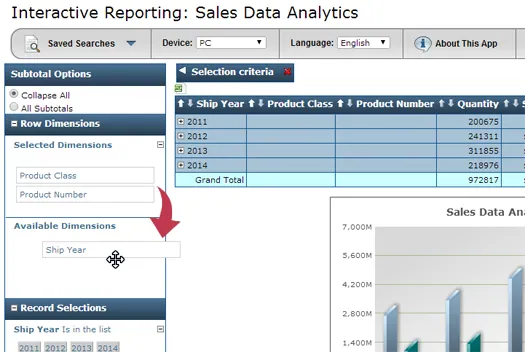
In a typical report, the end user cannot control which dimensions appear in their report, or the order in which they appear. For example, the report in figure 1 sorts data by shipping year. In a static report, that's unchangeable.
With this latest enhancement, end users can rearrange or remove that dimension from their report. They can now change the drill-down order within their report, letting them view their data from any angle they need.
Collapse and expand all subtotal rows
Interactive reports display high-level data, and let users drill down for more information. But, as they contain large amounts of data, expanding every row to view subtotal data was often tedious. This enhancement simplifies the process, giving users the option to expand or collapse all subtotal rows with a single click.
Embed interactive reports inside user-defined dashboards
Another popular BI tool, a user-defined dashboard is a customizable business dashboard. It lets users pull charts, graphs, and data from other applications and display it in a single dashboard. Each user controls the layout and the data displayed in their user-defined dashboard.
With this latest enhancement, users can now embed interactive reports within user-defined dashboards. This adds flexibility to both the user-defined dashboard and the interactive report.
"Already one of m-Power's most popular templates, the interactive report is a powerful BI tool," says Tyler Wassell, mrc's Manager of Software Development. "This new enhancement gives users even more great features that will help them better analyze their data."
###
Media contact:
Steve Hansen
Marketing Director, Michaels, Ross & Cole, Ltd.
Phone: 630.916.0662 x131
Email: mrc@mrc-productivity.com
About mrc
Michaels, Ross & Cole, Ltd. (mrc) is the creator of m-Power, a low-code development platform that lets organizations build custom web applications, reports, dashboards, portals, and workflows directly over their existing databases and systems.
With flexible deployment options (on-premises or cloud), perpetual licensing options, and unlimited users, m-Power helps IT teams deliver secure, tailored business software without vendor lock-in.