 I’m happy to announce that m-Power’s reporting and Business Intelligence (BI) capabilities just received a major boost! We just released an update that includes much improved graphing and charting capabilities, and I think you’ll love it.
Now, you’ll still find all of the charting features you’ve come to expect out of m-Power, like chart drill-downs, tooltips, mobile charting capabilities, etc… We didn’t remove any existing features. We did, however, add some new capabilities that will help you create better web applications with m-Power. For instance, m-Power users can now:
1. Create better looking reports and dashboards
The new, animated charts and graphs give m-Power applications a smoother, more attractive look and feel. Combined with m-Power’s point-and-click graphing interface, you can easily create attractive reports and dashboards in minutes.
2. Create additional application types
m-Power now comes with a greater variety of charting options. This opens the door to a far wider array of future m-Power templates, and lets you create additional application types, such as:
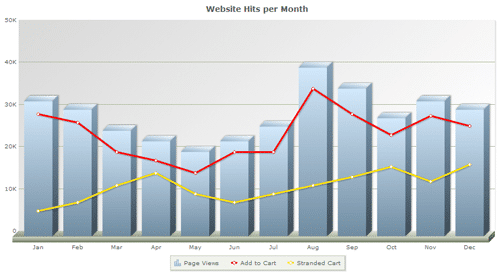
- Multi Line and Bar Combo Graphs: As illustrated below, this option combines two or more chart types into a single chart. It’s useful for comparing different data sets within the same chart.
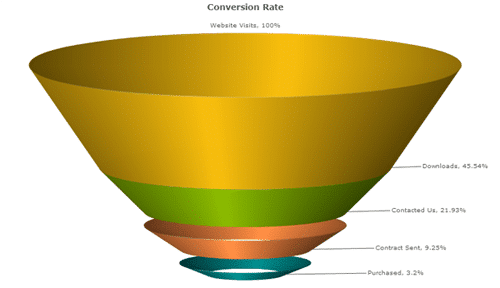
- Interactive Funnel Charts: As illustrated below, these charts help companies track areas like website conversion rate, sales cycles, and more.
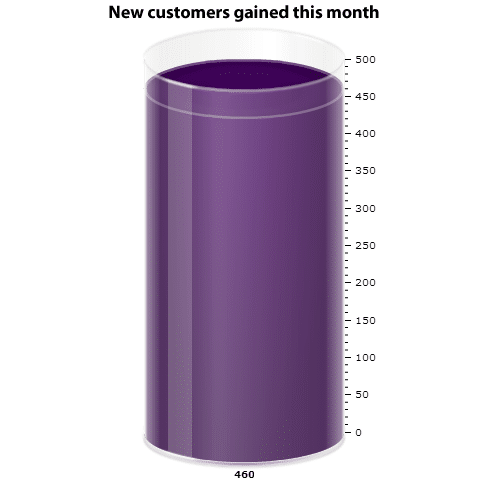
- Cylinder Charts: Cylinder charts are great for measuring Key Performance Indicators (KPIs), as well as progress towards a specific business goal.
- and much more.
3. Easily customize your charts and graphs
m-Power’s new graphing features also come with a wider array of customization options. It gives users more control over the look and feel, as well as the information displayed on each chart. You’ll find that you can develop and customize your charts more easily than ever.
To check out some of the new charts and graphs included in m-Power, visit this page: m-Power’s new charting demos.