 Summary: While many organizations use business dashboards, few actually use them to their full potential. Why? Some make key mistakes with their dashboards, while others have a very narrow view of dashboards. How can your business maximize the value of your business dashboards? In this article, we explore 6 ways to meet that goal.
I’ve seen dashboards used in all types of ways across the business world.
Some use them as executive-level tools–reserving dashboards only for the business leaders.
Others use them across their entire business.
Some businesses manually create and update their dashboards in spreadsheet programs.
Others automate the process.
Some view their dashboards as little more than charts on a page.
Others see them as key business tools.
The fact is, many businesses use dashboards, but not everyone sees the same results. For some, they’re a useful tool. For others, they’re a competitive advantage. Why is this? How can two different organizations use business dashboards, and see completely different results? How do some companies get so much value out of their dashboards?
It all boils down to how they’re used (and not used). Many businesses hold a very narrow view of dashboards. They use their dashboards for a single purpose, and completely ignore the full possibilities.
Other businesses recognize the potential benefits and maximize their dashboard’s value. How? Today, let’s explore a few ways you can do the same. Here are 6 ways to maximize the value of your business dashboards:
1. Expand their reach

How are you using your dashboards? As a sales tool? As an executive tool? Too many businesses make the mistake of using a dashboard for a single purpose.
If you’re only using dashboards in a single department, or for a single purpose, you’re limiting its value. Your dashboards can be so much more.
To get the most out of a dashboard, expand its reach across your entire business. As explained below, dashboards should be available across all departments.
“Businesses shouldn’t just use the dashboards during executive meetings, or worse, leave it to the CEO to evaluate the results and KPIs on the dashboard,” says Karola Karlson, Content Marketing Manager at Scoro. “Instead, companies should create multiple dashboards: one for each department, or even one for each employee, so that they can include smaller metrics that are relevant specifically to their job.”
2. Make dashboards proactive
A good dashboard helps you understand your business in real-time. It lets you spot, and fix problems as they occur.
But, what happens if a problem occurs, and you’re not staring at your dashboard?
For most businesses, it means they’ll catch the problem a few hours later–whenever they get around to checking your dashboard. But, it doesn’t have to be that way. As explained below, if you want to truly maximize your dashboard’s value, set up proactive alerts.
“Seek a two-way relationship with your dashboard,” says Freddy Mini, CEO of Netvibes. “One that just aggregates and passively presents data is one that depends on you spending precious time each day looking for actionable trends. But like a good friend, a proper dashboard won’t wait for you to sign in to tell you that your competitor’s CEO just resigned or that Reddit chatter is boosting your website hits. Set up your analytics to automatically notify you (and anyone else who should know) under important conditions via email or SMS, or even trigger any kind of business action. Like magic potions working for you, it could automatically re-post high-performing content across other channels or add calendar events for a meeting should a crisis occur.”
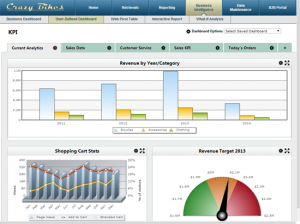
3. Make them customizable
Many dashboards display a pre-determined set of metrics in a pre-set layout. While each department might get their own dashboard, users within that department are stuck with a static layout.
For instance, a sales dashboard might display metrics like daily/monthly product sales, geographical sales numbers, top customers, and salesperson performance, to name a few. If one sales manager needed additional metrics, or metrics that differ from the other sales manager’s dashboards, they run into problems. They must either create a brand new dashboard themselves, or request a new dashboard from the IT department.
If you really want to get the most out of your dashboards, deliver customizable dashboards. Give each user the ability to adapt their dashboard to meet their own specific needs.
“A dashboard is not a baseball cap — One size does not fit all, so tailor research findings to stakeholders in order to meet individual needs,” says John Bird, VP of North America, Dapresy. “For example, your sales VP and CFO likely want to see different information presented, and may have preferences in terms of how it is presented. This should easily be managed by user login and/or hierarchical filters.”
4. Include benchmarks
Many dashboards track data, without providing goals or reference points. To truly maximize your dashboard’s value, you must track each of these data points.
For example, suppose your dashboard shows that you’ve shipped 100 units this month. Or, suppose it shows you that your website conversion rate is 15%. Are those numbers good? Can they be improved? Is this better or worse than last month? Without goals, historical data, or industry benchmarks, there’s no way to know.
To get the most out of your dashboards, include goals and benchmarks with each chart. As explained below, this not only helps you compare progress towards a goal, it can even foster healthy competition.
“We have a sales dashboard with the current monthly recurring revenue (benchmarked to compare against the actual result), KPIs that show the monthly results of sales teams in multiple countries, and much more (we can share the complete list of KPIs),” says Karlson. “The main benefit: our sales team uses the dashboard during meetings to get a quick overview of how well they’re performing compared to each other and compared to the previous months. Moreover, it is highly motivating to showcase individual results before the entire sales team, as everyone wants to be the best.”
5. Automate the data

Many businesses make a critical mistake that cripples their dashboards. They create dashboards that rely on manual data updates. They put an employee (or employees) in charge of manually keeping the dashboard’s data current.
What happens? Besides the obvious time waste, it leads to out-of-date dashboards. While it may work for a little while, sooner or later, the employee gets busy and forgets to update the dashboard. Meanwhile, the business goes on using it, assuming everything is current.
The results can be disastrous. Out-of-date dashboards can be worse than not having a dashboard in the first place, as they lead to decisions based on faulty data.
“On the technical end, use tools that automatically pull from your data sources,” says Daniel Sanders, Client Service Ambassador at J – I.T. Outsource. “If you’re using Excel, automate the updating of the data to pull from the source, don’t just put charts on a file and call it a dashboard. A truly useful dashboard will be dynamic, automatically updating to give you a true, up-to-the-minute view of what’s really going on in your business.”
6. Bring them out of the confines of the PC
In today’s increasingly mobile workplace, employees aren’t tied to their desks anymore. Dashboards shouldn’t be tied to the desktop.
Now, this goes beyond tablets and smartphones–though creating mobile dashboard versions are important. It’s all about giving your users the data they need, when and where they need it.
For example, I know of one manufacturing company that displays dashboards on their shop floor. The dashboards track progress towards daily shipping goals throughout the day, and are always accessible to their employees.
As another example, I know of other companies that create adaptable dashboards. A single dashboard will look and feel different depending on the device on which it’s accessed. For instance, suppose a user is analyzing a dashboard on their PC in the office, but then has to go catch a train home. They can access that same dashboard on their smartphone or tablet, and it will automatically adapt to the device.
If you truly want to maximize your dashboard’s value, you must bring it out of the confines of the desktop. Make it available wherever and whenever your users need it.
Summary
Now, these are just 6 ways to maximize the value of your business dashboards, but the list could go on. If you would like to add anything to this list, I’d love to hear it. Feel free to share in the comments.
Having a dashboard that is customizable is an ideal attribute in any business intelligence solution. While sure, most departments can find some useful information in base-line reports, each department has its own unique goals and metrics. Being able to plug-and-play with metrics of the utmost importance to a specific department brings more of your organization on board while also providing highly relevant information to influence decision making.
Pingback: How to Maximize the Value of Business Dashboards - Dapresy