Skip to Content mrc logo mrc logo
  • What is m-Power?
    Overview Demos Build Process Case Studies Specs Pricing Trial
    m-Power Resources
    Overview How-To Videos Webinars & Podcasts White Papers Fact Sheets
  • What does m-Power build?
    Overview Database Front-Ends Reporting CRM Systems Business Intelligence Dashboards Inventory Management Mobile Apps ERP Enhancements Modernization Spreadsheets to the Web MS Access to the Web B2B/Web Portals Scheduling Embedded Analytics Web Forms Workflow Data Exploration Budgeting & Forecasting APIs & Web Services Db2 Web Query Alternative
    Solutions by Industry
    Overview Manufacturing Government Foodservice Software Vendors Logistics & Supply Chain Software Consultants Healthcare
  • Development Services Training Mentoring
  • Overview Partners Press Releases Careers Events Contact Blog
  • Support Home FAQ Documentation Customer Portal Enhancements Updates Roadmap Techblog
Try m-Power

m-Power Manual

Browse:

  • Home
  • Graphs
  • Displaying Multiple Graphs in a Report
Back to Manual

Displaying Multiple Graphs in a Report


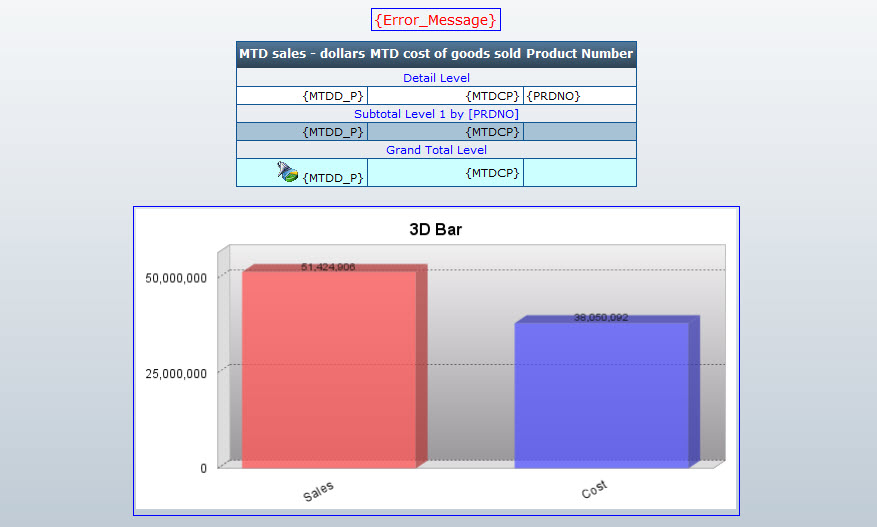
The Report with Graph templates allow you to have multiple graphs within a single Report. This documentation will illustrate how to set up two graphs, one for the Detail Level and one for Sub-Total Level. To start, build your application using the Report with Graph template as you normally would and enter m-Painter. This is the defaulted m-Painter Screen (graphing grand total information).

  • To add another graph, click within m-Painter, then click the "Insert/Edit Graph" icon in the m-Painter toolbar.
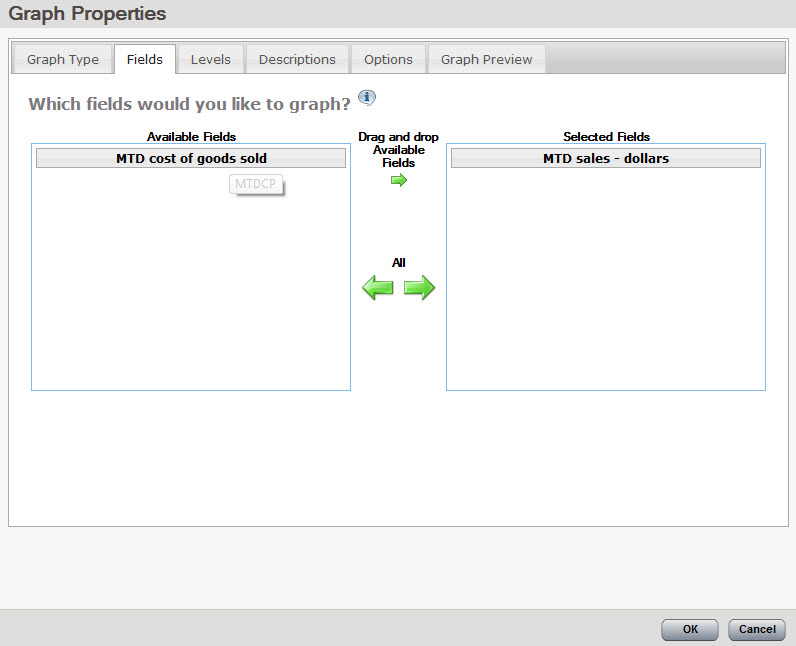
  • A pop-up window (Graph Properties) will display asking you what you would like to graph in your new image.
      1. In the "Fields" tab, select "MTD Sales – Dollars".

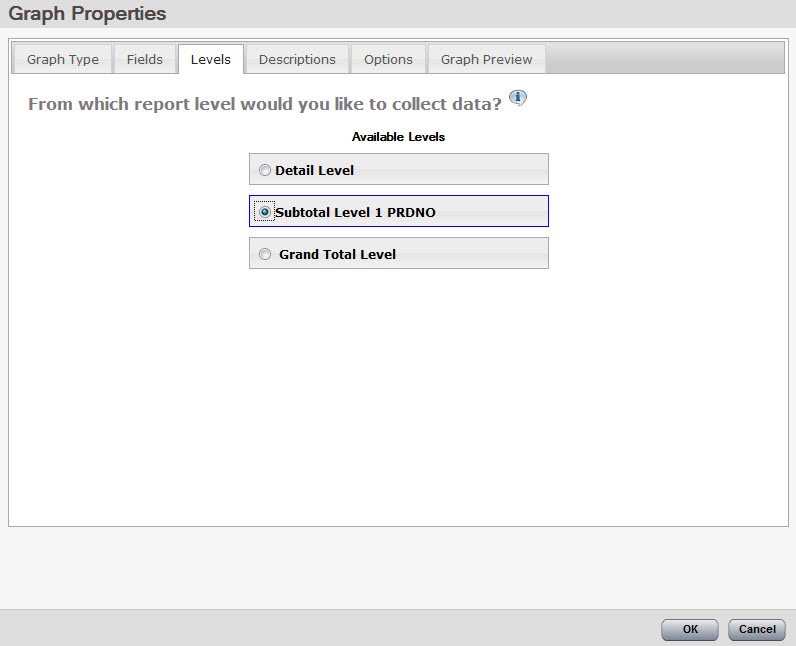
      1. On the "Levels" tab, select "Subtotal". Click "OK".

Congratulations, you have just set up a second graph!

Now we will reconfigure the original graph to utilize Subtotal Information in the form of a Pie Graph, graphing "MTD Sales – Dollars":

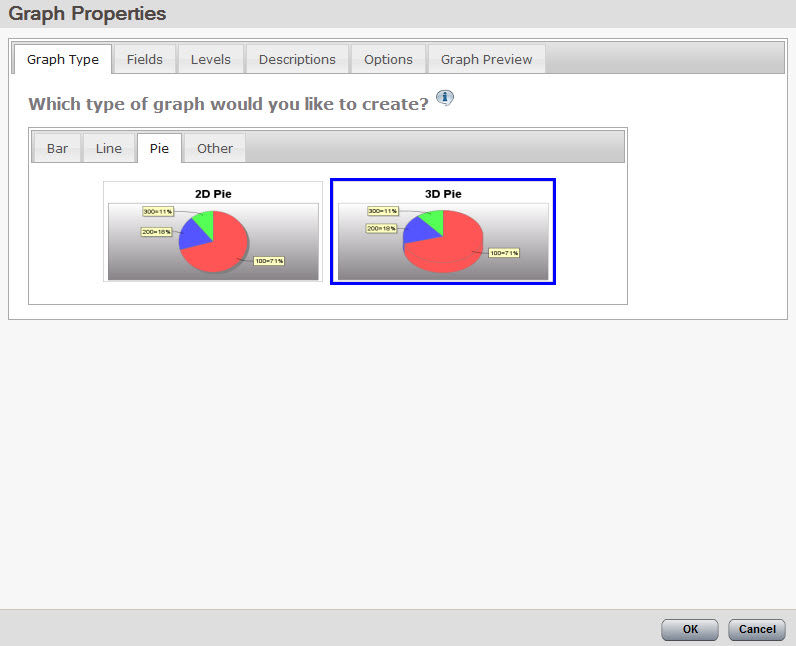
    1. Right click on the original graph and select "Graph Properties".
    2. Select the "3D Pie Chart" option.

    1. Select the "Fields" tab and make sure the "MTD Sales – Dollars" field is being graphed.

    1. Next, select the "Levels" tab and choose the "Subtotal 1" level.

  1. Click "OK".

After putting both graphs side-by-side, the output now looks like this:

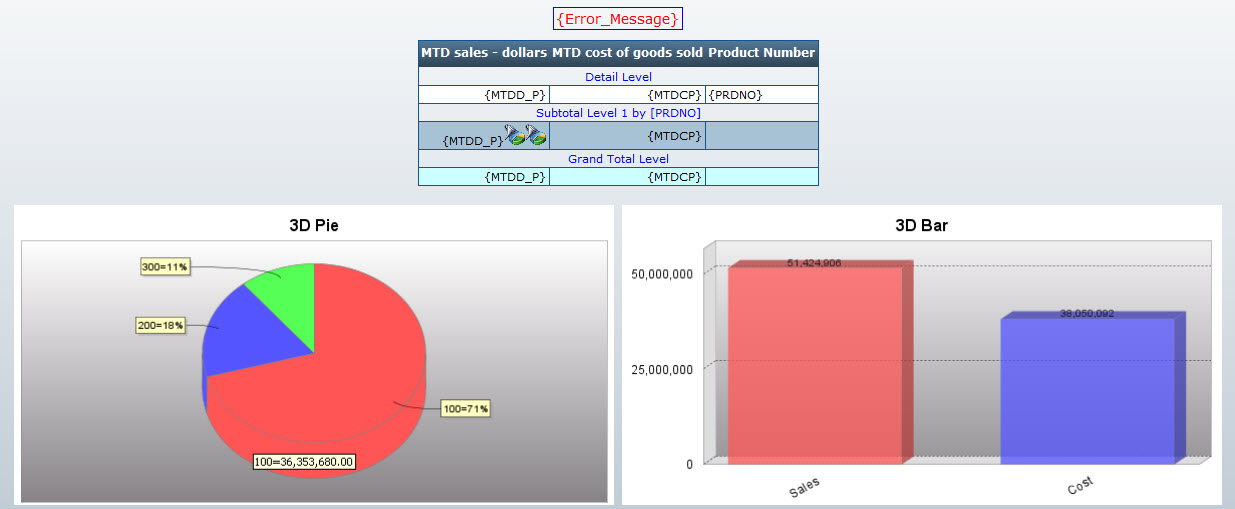
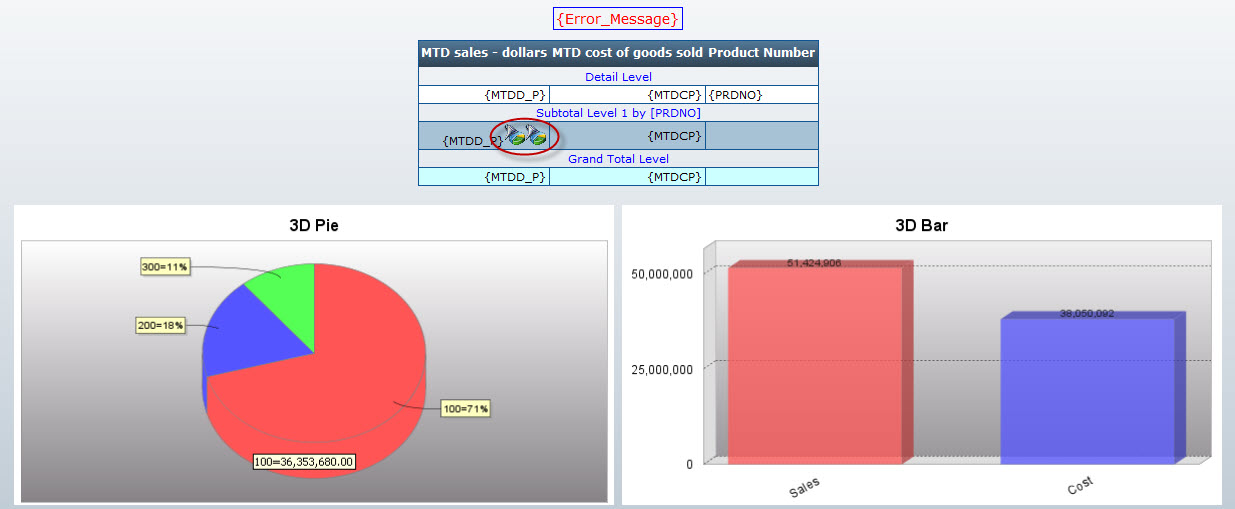
Note: Always ensure that your image data collectors are in the correct place within the table. In this example, we are graphing both graphs at the Subtotal level, therefore the image data collectors are both in the table at that level. If you delete or move them elsewhere, the graph may not work properly.

Note:

It is important to note that you can change the way either of these graphs look and perform by simply right-clicking on the graph in question and selecting "Graph Properties". These graph properties will perform independently of each other. Ultimately, making a change to one graph will have no effect on any other graphs being used in the application.

Created: May 6, 2008 | Modified: June 12, 2017

Search


Browse By Category

Build Process (13)
Starting with m-Power (8)
Retrievals (10)
Reports (15)
Summaries (4)
Maintainers (17)
Graphs (8)
m-Power Data Explorer (4)
General (24)
Calculations (5)
Utilities (9)
m-Power Administration (23)
Security (11)
Freemarker (6)
m-Painter (29)
Form Validation (5)
External Objects & UDFs (12)
Deprecated Documentation (23)
Bootstrap Templates (7)

Popular Tags

Parameters Dropdowns Production App Properties Maintainer Popular Data Dictionary m-Painter Security Compiling Calculations Java Graphs Maintainers Administration Email Graph Properties DB2 SQL Tomcat Form Validation Build Process Retrieval Prompt Screens Admin Advanced External Objects Dates Getting Started Performance Freemarker Excel Application Properties RPG Bar Graphs Database Summaries Bootstrap Templates Report Record Selections Reports Video mrc-Productivity Series Retrievals Graphing

See all tags »

michaels, ross & cole, ltd. (mrc)

Privacy Policy Cookie Policy Cookie Settings Notice at Collection Do Not Sell or Share My Personal Information

mrc (US)

2001 Midwest Road
Suite 310
Oak Brook, IL 60523
630-916-0662

mrc (UK)

Mortlake Business Centre
20 Mortlake High Street
London, SW14 8JN
+44-20-335-59566


© mrc. All rights reserved.