Customizing the User Defined Dashboard at Runtime
The User-Defined Dashboard allows end-users to create their own dashboard by selecting applications from a list of designated applications. This dashboard can be saved to the dashboard list (either privately or publicly), so that each user can set up and work with his or her own dashboard. More importantly, this can be done without affecting the dashboard of any other user.
When an end-user first accesses the dashboard, it will appear like so:
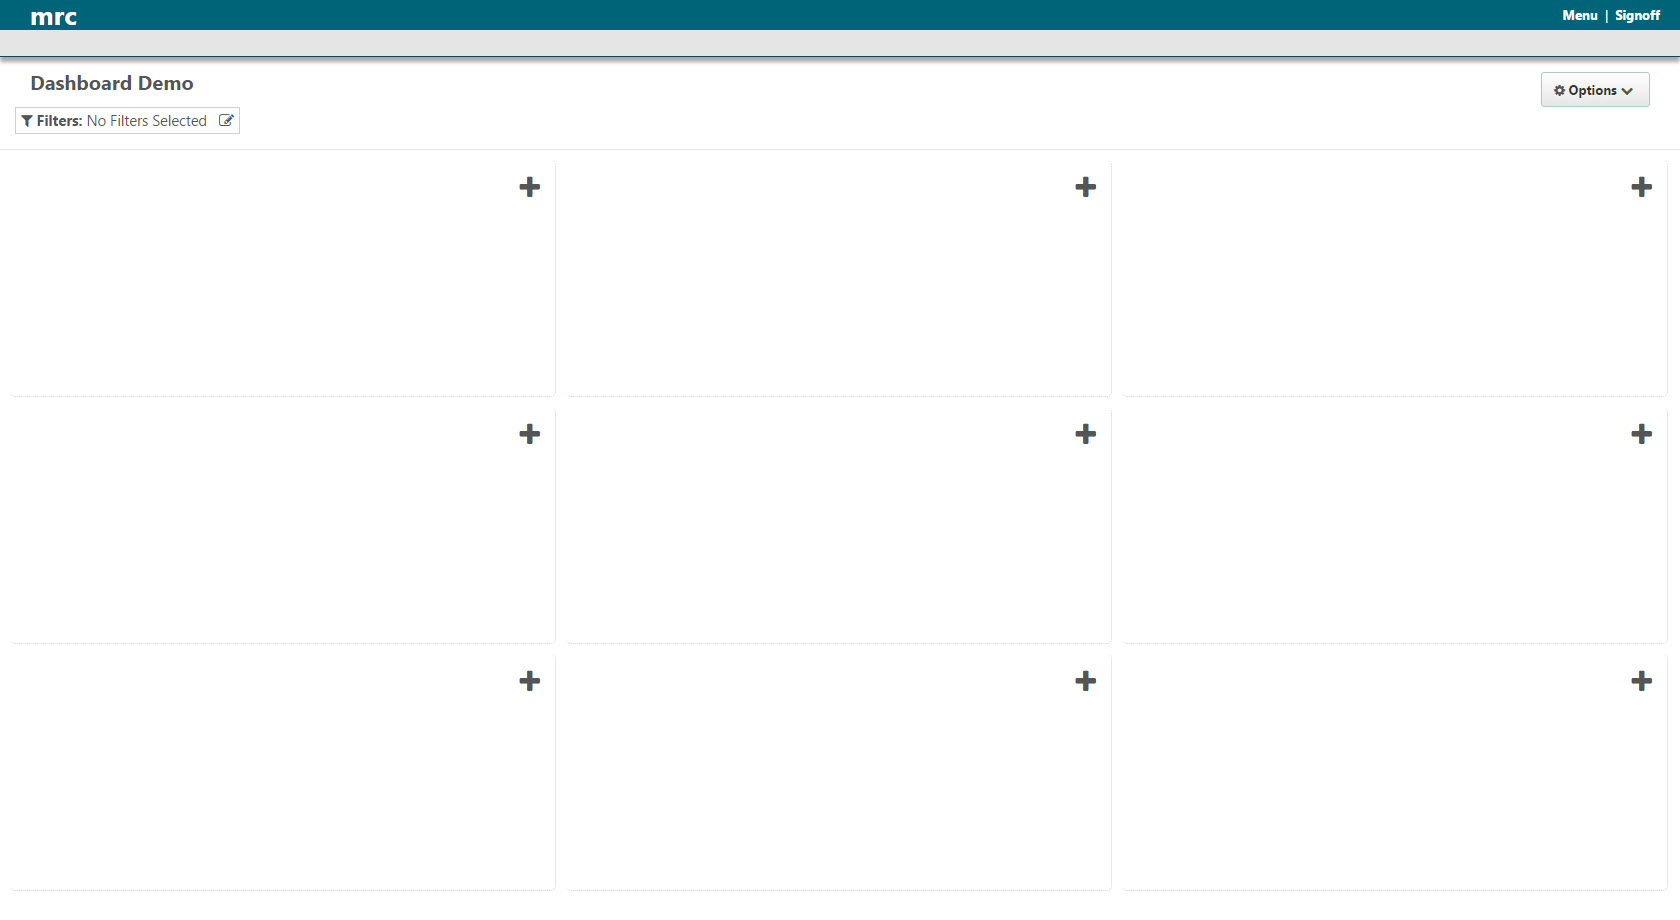
Each tile is a placeholder for any application made available by an m-Power developer. By default, each dashboard will load with nine blank tiles. If the developer has created one, a default dashboard will load with pre-defined applications already replacing the blank tiles.
Configuring the Dashboard
Adding an Application
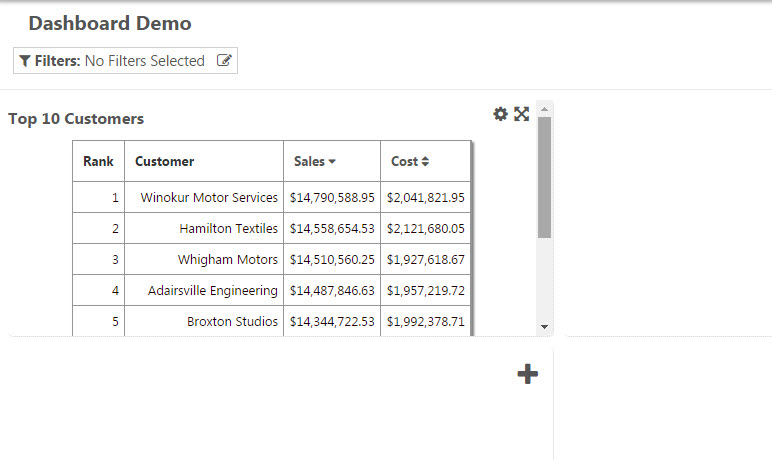
The end-user will customize the dashboard’s appearance. To add an application to the dashboard, click on an empty tile and a window will appear. This window will be a list of all applications the developer has designated to be available to the end-user. Select the application you wish to add and the application should then appear in the tile.
Dashboard Layout
Depending on the application design, you may notice the tile is not properly sized for displaying the data. You have different options for controlling the appearance of your dashboard. The first is to display a full sized version of the application. To do so, click the expanding-arrows icon in the top-right corner of the tile. You can revert to the smaller version of the application by clicking the collapsing arrows button at the top-right corner. Another display option is to change the size of the individual tiles. To do so, click on the 'gear' in the tile you wish to resize. This will open the Application Options.
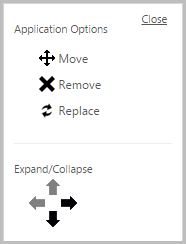
Clicking on the four arrows at the bottom causes the application to expand or collapse. You can only expand down and to the right, and collapse up and to the left. You can also move the application. To do so, click the ‘Move’ icon, and then the tile where you wish to move the application. Note: If you move the tile, any changes made to the size will be lost and will revert to default size. Clicking ‘Replace’ will allow you to select another application from the list. Additionally, if you perform any selections, you can save these to the individual tile.
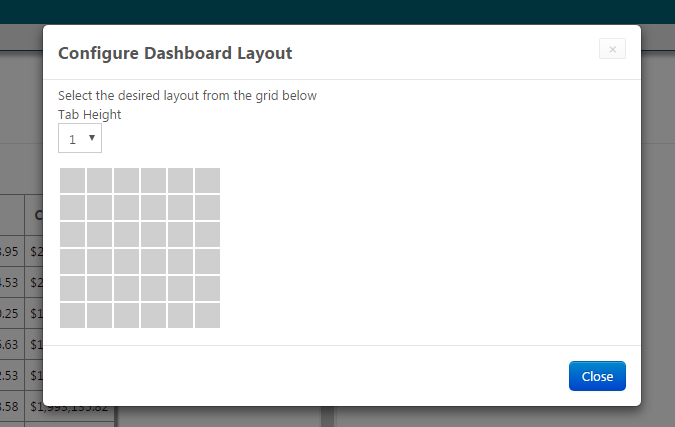
Alternatively, you may want to change the number of widgets appearing on the page. To do so, click the Options button and select 'Configure Dashboard Layout'. Within this window, designate the tile height and change the layout of the grid. If the application is long, you may want to change the height. This can be done by selecting a height from the dropdown. Depending on the width of the application, you may need to change the layout. Your current layout appears as the dark squares. Hover over the layout to show the different layouts available. Notice that the squares will turn blue depending on the location of your cursor. Once you click on one of the blue squares, your dashboard will take the layout of those squares.
Using the Dashboard
Saving the Dashboard
You must save your dashboard settings if you wish to leave the page and return to the configured dashboard at a later time. From the Options button, you can either click on 'Save Current Layout in Browser' to save the dashboard to your browser session. This will only be available to your user, on your current computer, and browser and will be the default when you load the dashboard. The other option is to add your dashboard to the dashboard list. This will launch a window allowing you to enter a name and choose if it should be public or only available to your user. Note that you can completely clear the dashboard by clicking 'Reset Dashboard'. Load any saved dashboards by clicking the 'Open a Dashboard' option in this menu. Dashboards saved for your user and any public dashboards will be available in this list. Finally, you have the option of sharing your configured dashboard via a URL link by selecting the 'Share Dashboard' option.
Dashboard Filtering
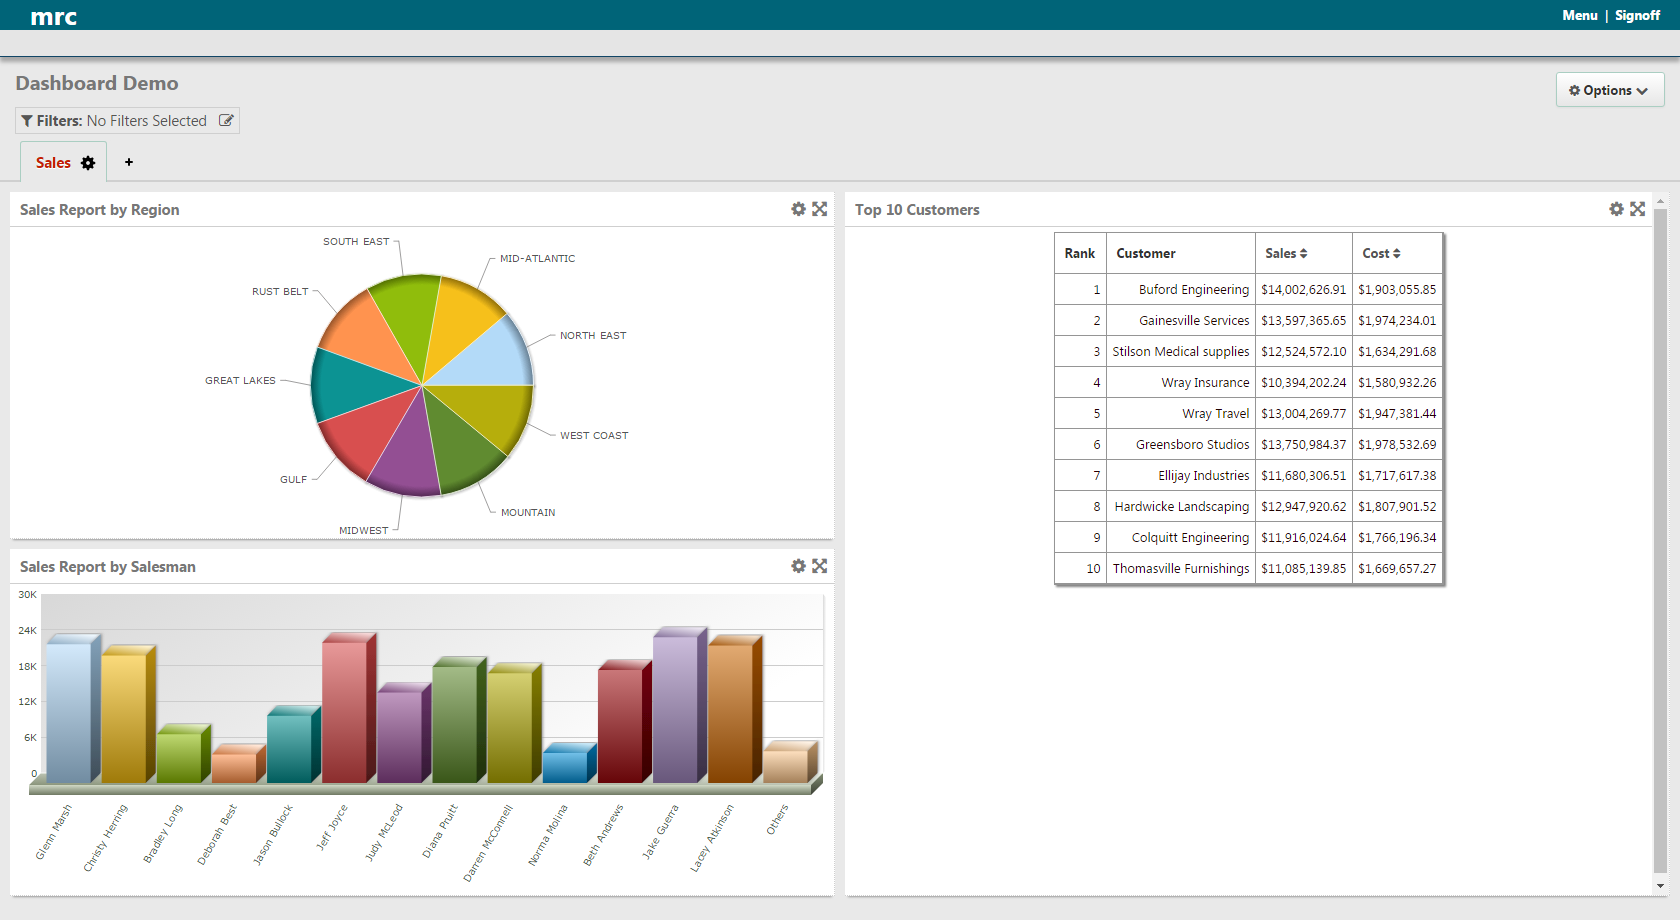
Once you have set up your dashboard, each application tile functions independently of the others. You can sort, search, and perform record selections depending on the application’s design. However, if the m-Power developer has configured filter criteria, you can perform record selections over the entire dashboard. If the developer has enabled this, you will see a filter option in the top-left corner of the window. Make the desired selections and once you click 'Run Dashboard', the applications that have been configured to listen to the filter criteria will load with your selections.
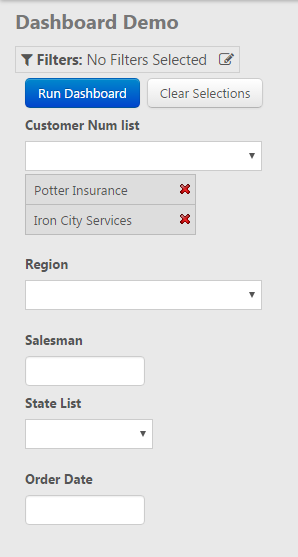
Additionally, if configured by an m-Power developer the graphs on your dashboard may be used to filter other applications as well. For example, you may click on a specific slice of pie to filter other apps by the specific region or you can click on a specific bar to filter by a specific salesman.
Important Notes
I created my dashboard, left the page and came back to it. Now my dashboard’s empty. What happened to all of my settings?
–After you change your dashboard, you have to save it to keep the settings. You can save the dashboard by clicking 'Options' in the top right of the screen, and then selecting 'Save Current Layout in Browser'. This will save your settings locally on the computer you are using. If you wish to access this dashboard from anywhere, or make visible to other users, you can select the 'Add to Dashboard List' option.
I added a dashboard to the Dashboard List but I am not seeing it.
–Please verify that your "mrc-runtime.properties" file (\m-power\mrcjava\WEB-INF\classes\) has the lines "mrc_data_store=mrc" and "mrc_data_store_ip=https://localhost:8011" (assuming you are using the default m-Power port)
I’m missing the 'Filters' option in my dashboard. What happened to it?
–This window is only created if the dashboard developer has configured at least one filter criteria.
How can I rename the individual tiles in my dashboard?
–The names for the tiles are specified by the dashboard developer and cannot be changed by the end user.
Am I able to move my saved dashboard list from development to production?
–The saved dashboard list is stored in a json file on the server in the \m-power\mrcjava\mrcdd\ folder. The filename structure will be DICTIONARYdashboardname.json (DICTIONARY is the name of the dictionary and dashboardname is the name of the dashboard). Copy this file to the same location in production.
For information on configuring a dashboard within the m-Power interface, please see:
Setting up the User Defined Dashboard Within the m-Power Interface.