Setting up the User-Defined Dashboard within the m-Power Interface
The User-Defined Dashboard allows end users to choose an existing dashboard layout, or create their own by selecting applications from a list of developer designated applications. Any dashboard settings made by the user can be saved within their browser or to the server; this allows each user to make adjustments to the dashboard and save their changes separately. These user created dashboards can then be shared via URL, or made public to other users. 
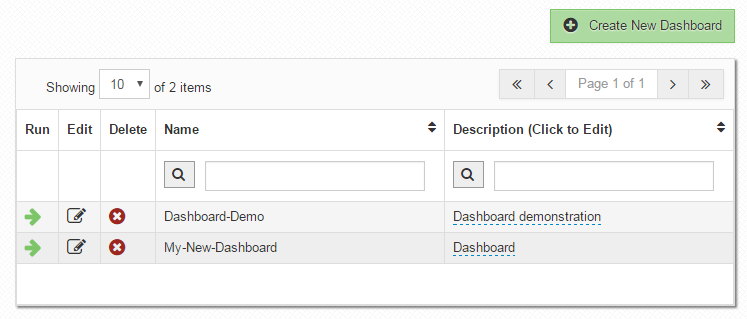
To configure a dashboard, select 'Dashboards' on the left toolbar within the m-Power interface. This will bring you to a listing of all configured dashboards for your current data dictionary.
Creating a Dashboard
To add a dashboard to this list, click the green plus sign.
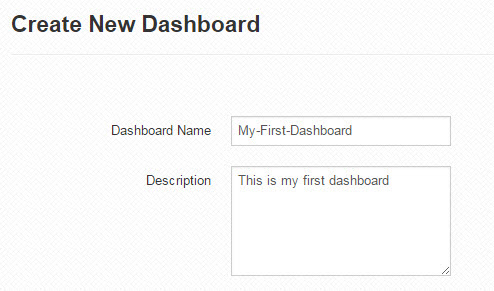
Enter a name and description. Note: If your dashboard name has any spaces in it, these will be converted to dashes. However, at runtime, any dashes within the name will be converted to spaces. Click accept.
Adding Applications to the Dashboard
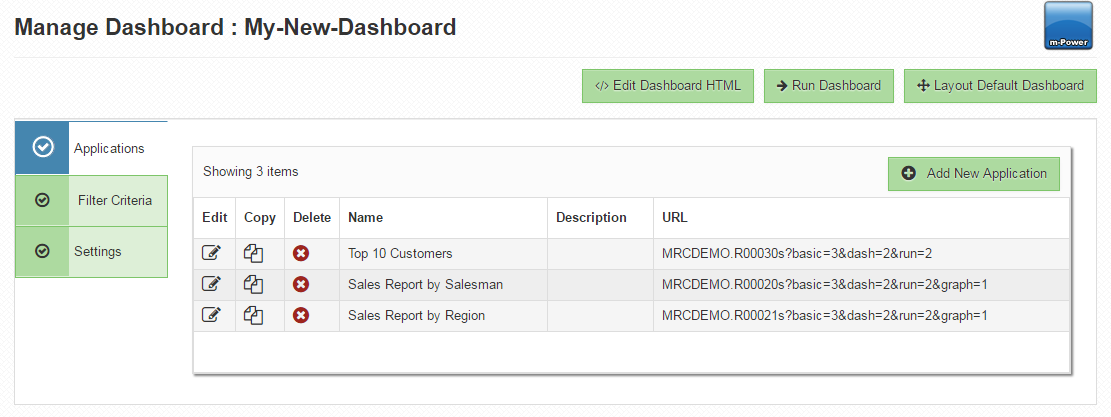
We are now ready to add our first application to the dashboard. Click the edit button on your dashboard. This will bring you to Manage Dashboard screen.
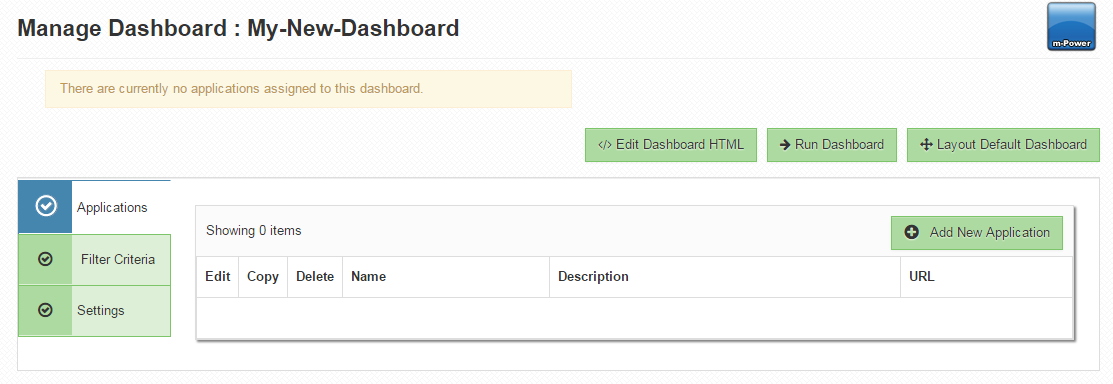
Click on the 'Add New Application' button
Select the dictionary, application type, and application name from the dropdowns. The 'Additional App Parameters' and 'Title' input boxes will be auto-populated. In the 'Additional App Parameters' input box you will see the text basic=3, dash=2, and run=2. These parameters optimize the application's appearance to be loaded from within a dashboard. The 'Title' input box will display the name of the application and will be seen by end-users at runtime. You can change this if you like.
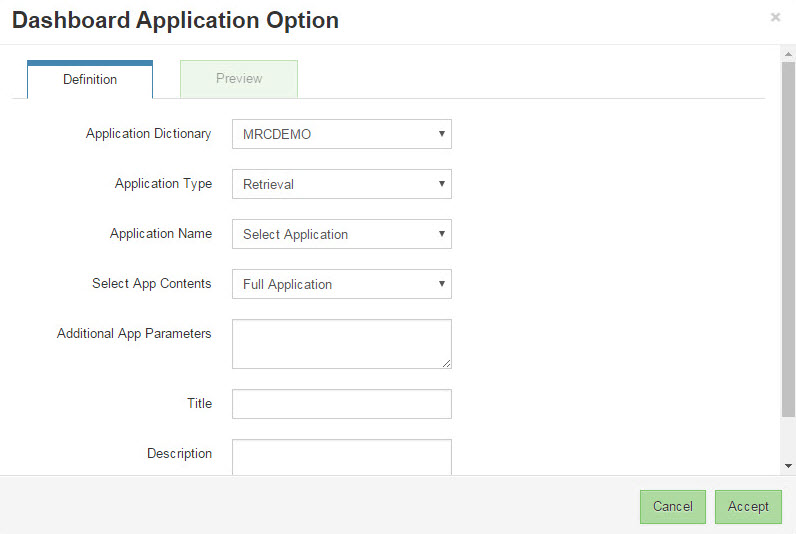
You have the option of seeing a preview of your application as it should appear in your dashboard with the 'Preview' tab.
Once saved, your application will be added to the list of available applications in your dashboard.
If you’ve created a dashboard record selection with a matching field in this application, you can click ‘Map Selection Criteria’ to filter your application, based on the dashboard criteria value.
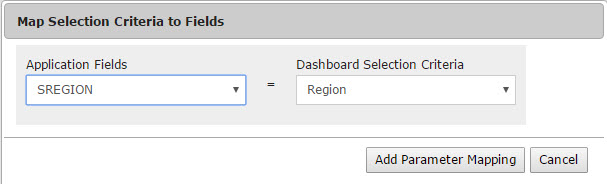
Select the field in the application you wish to apply the record selection to from the first dropdown. Select the appropriate dashboard criteria from the second dropdown. Once finished, click ‘Add Parameter Mapping’. I can now see that m-Power has automatically added some parameters to the Additional App Parameters box. My screen will now appear as so:
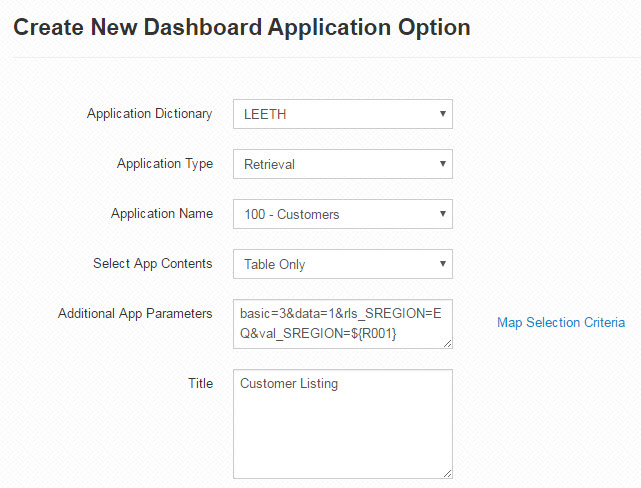
The mapping will appear differently depending on whether the record selection is a Single Value, Multiple Values, or Range. Once you’ve added your mapping, add a title and a description. These will only appear within the dashboard listing in the interface, and will not be shown to the end-users. Once you are finished, click accept. This will bring you back to the dashboard listing page. You are now ready to run your dashboard. Click on the green arrow to the left of the dashboard name to run the dashboard.
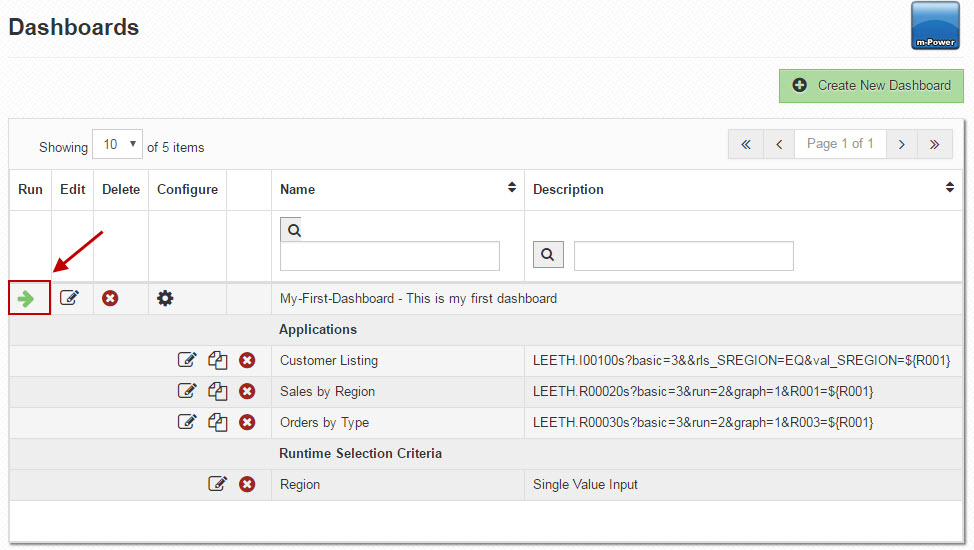
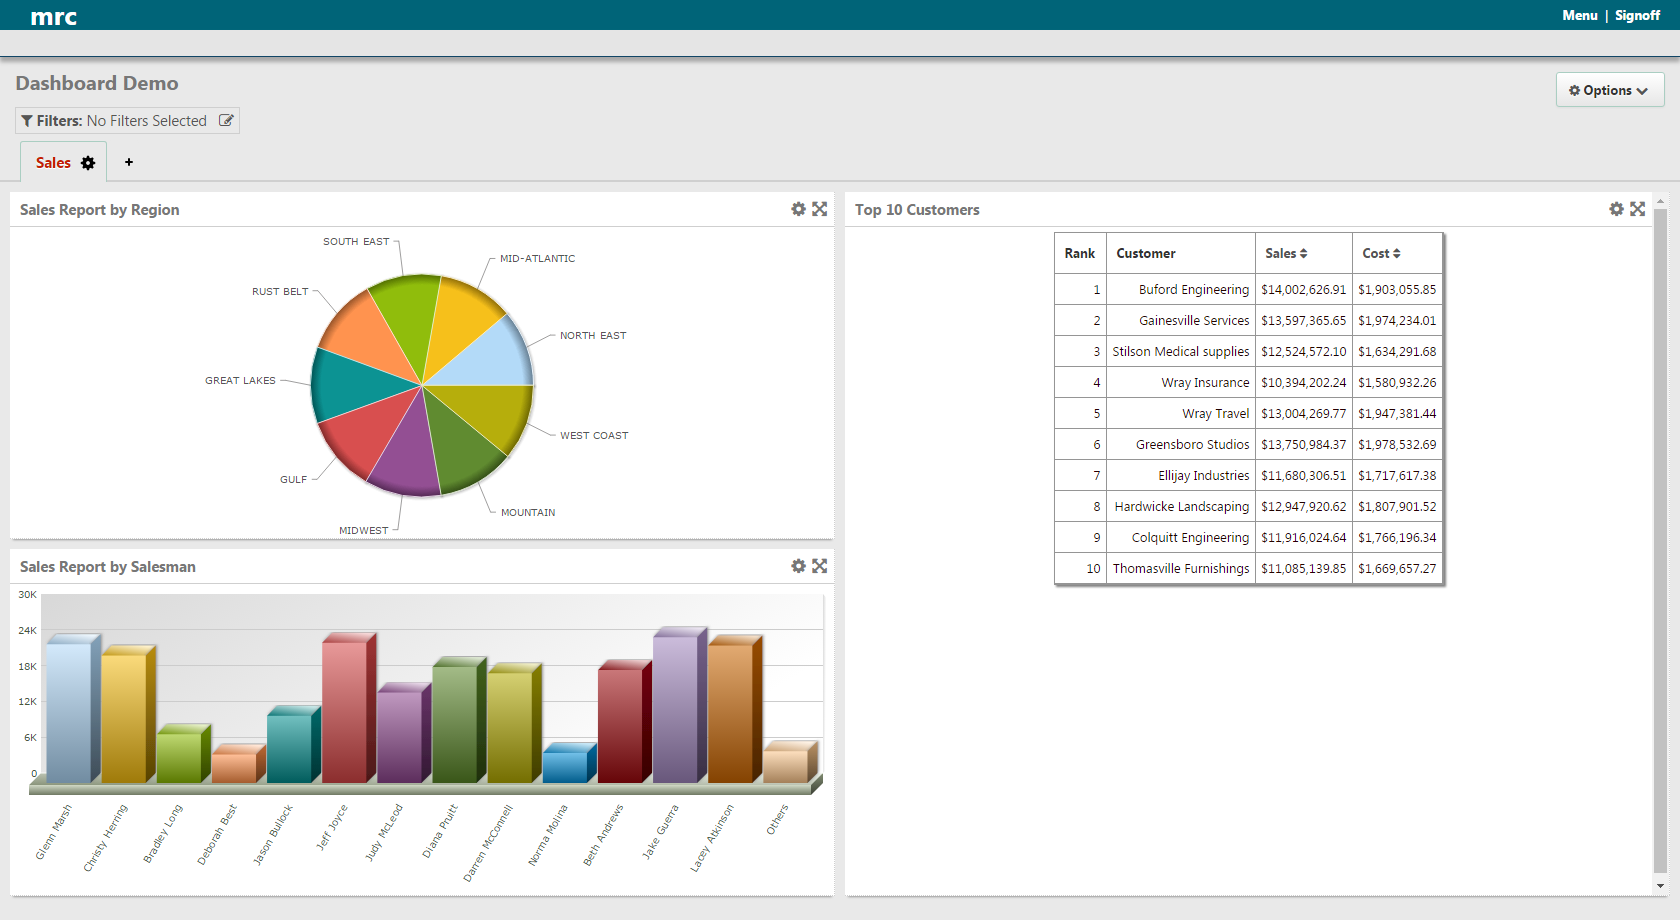
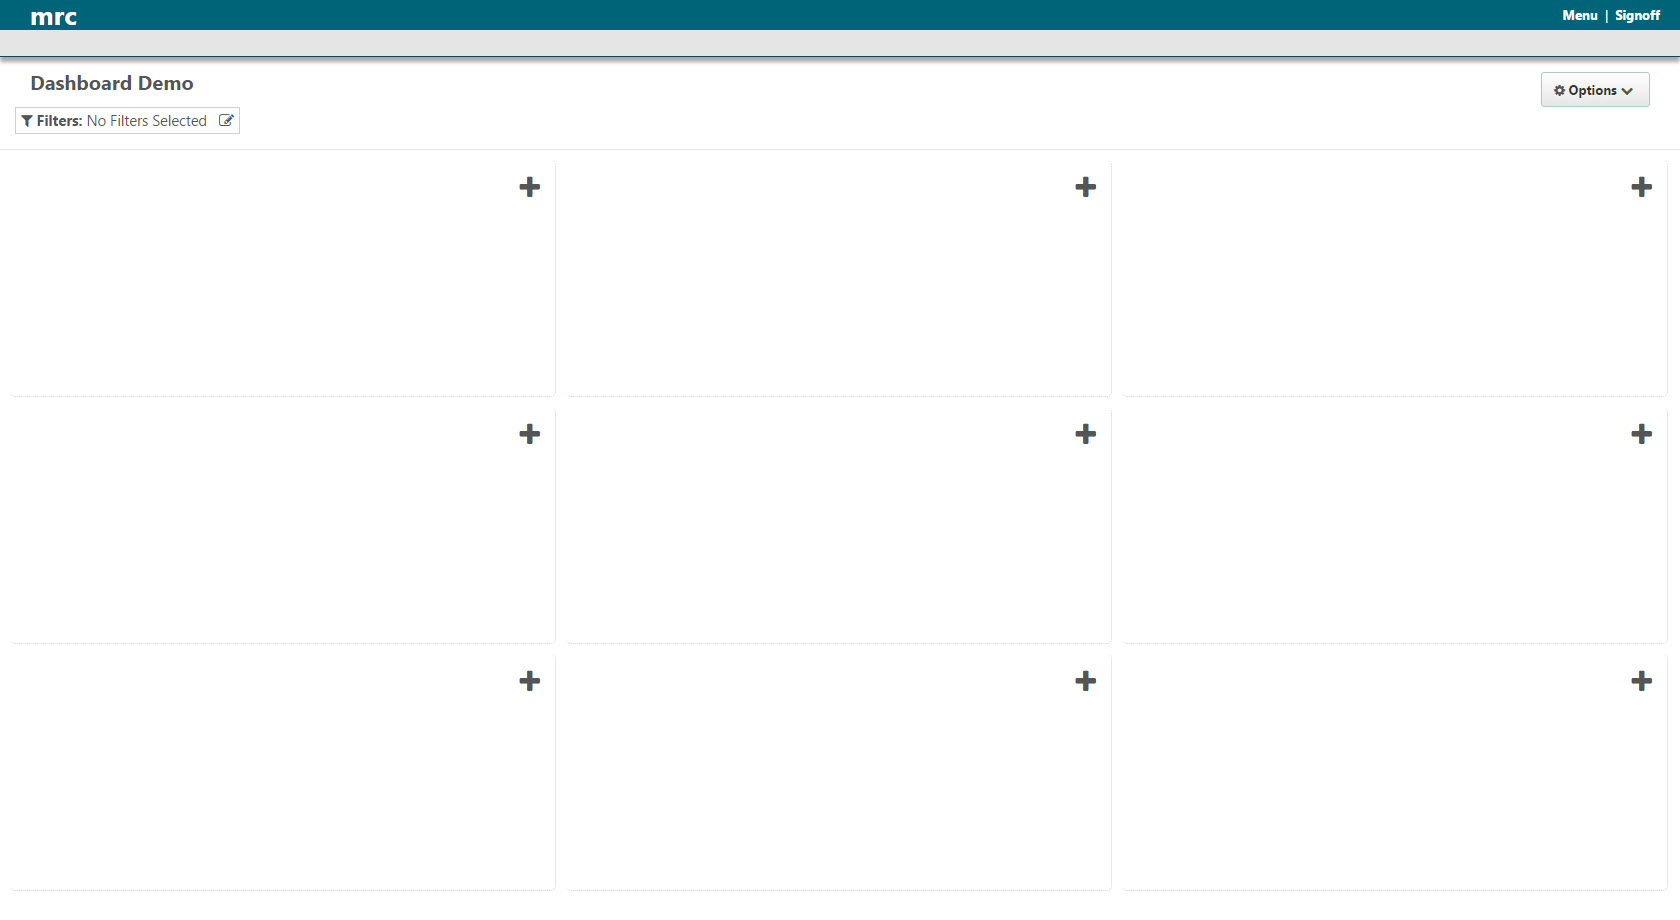
After the dashboard has been setup, upon execution, the end-user will see the following screen. This is a blank canvas where you or your end user can design the dashboard's layout. Please proceed to Customizing the User Defined Dashboard at Runtime for more information.
Adding Runtime Selection Criteria
Click ‘Configure’. This will open a small window.
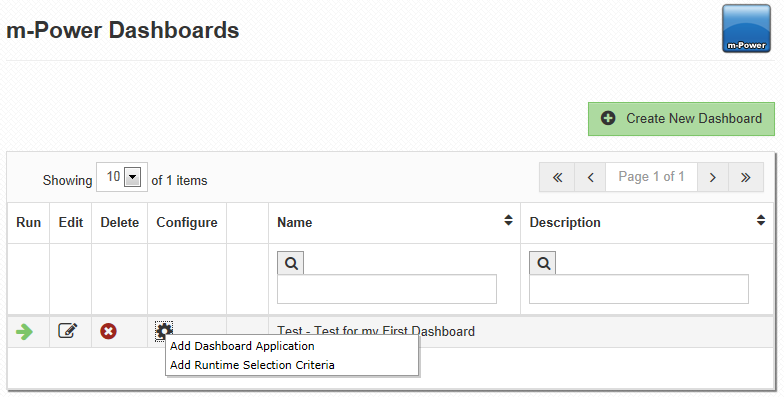
Now you can either add an application to the dashboard, or add record selection criteria. This criteria in a dashboard works the same as a runtime record selection in an application. However, selection criteria in a dashboard allows the user to enter a value which will filter any applications assigned to the dashboard.
After clicking ‘Add Runtime Selection Criteria’, you will be brought to the Add New Dashboard Selection screen. Enter the description that you would like the end-users to see. My selection will filter all applications based on the entered Region Number, so I will set my description to Region:
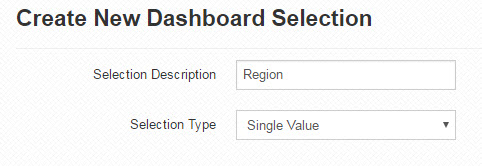
Here, you have the option to allow users to enter a single value, multiple values, or a range of values. For my example, I will select Single Value. Click accept to save this selection, and return to the dashboard listing.
Customizing the Selection Dialog/Panel
Once in the listing, click ‘Configure’. Note that an additional option has been created within this list, ‘Generate/Customize Selection Dialog’. This will allow you to edit the Dashboard Selection Criteria inputs as they appear in the selection dialog or left selections panel (depending upon the option you selected when first creating the dashboard). If you have not designated any selections, you can continue to Adding an Application. If you have added selection criteria, you must generate the HTML that will allow the criteria to appear at runtime. If this is the first time you click on this link, you will immediately be brought to m-Painter, where you can customize the selections. If you have previously clicked on this link, you will see this window:
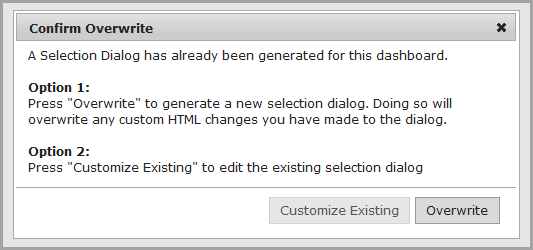
You can either edit the existing presentation layer for the selection criteria, or revert to the default and edit that instead. This is the same concept as overwriting the HTML of an application After you make a selection you will be brought into m-Painter. Once you have finished customizing the selections, you are ready to add applications to the dashboard.
Promoting the Dashboard to Production
You can promote a dashboard to production by promoting the entire data dictionary. Note that any applications that are in the dashboard but not in the same data dictionary will need to be promoted as well.
If you only want to promote the dashboard, you will need to promote the following files:
mrc_dashboards.txt
'DASHBOARD-NAME'_dashboard.html
'DASHBOARD-NAME'_d.html
These files can all be found in \mrcjava\WEB-INF\classes\'DATA DICTIONARY', where 'DATA DICTIONARY' is the data dictionary name. Additionally, the web.xml file in the mrcjava\WEB-INF folder also must be promoted. Replace 'DASHBOARD-NAME' with the name of the dashboard you wish to promote. The 'DASHBOARD-NAME'_d.html file contains the HTML for the dashboard selections, therefore this file is only created if selections have been generated.