mrc logo mrc logo
  • m-Power m-Power
    What is m-Power?
    Overview Demos Build Process Case Studies Specs Pricing Trial
    m-Power Resources
    Overview How-To Videos Webinars & Podcasts White Papers Fact Sheets
  • Solutions Solutions
    What does m-Power build?
    Overview Database Front-Ends Reporting CRM Systems Business Intelligence Dashboards Inventory Management Mobile Apps ERP Enhancements Modernization Spreadsheets to the web MS Access to the web B2B/Web Portals Scheduling Embedded Analytics Web Forms Workflow Data Exploration Budgeting & Forecasting APIs and Web Services Db2 Web Query Alternative
    Solutions by Industry
    Overview Manufacturing Government Foodservice Software Vendors Logistics & Supply Chain Software Consultants Healthcare
  • Services Services
    Development Services Training Mentoring
  • About About
    Overview Partners Press Releases Careers Events Contact Blog
  • Support Support
    Support Home FAQ Documentation Customer Portal Enhancements Updates Roadmap Techblog
Try m-Power

m-Power Manual

Browse:

  • Home
  • Graphs
  • Create a Speedometer Chart
Back to Manual

Create Speedometers


A speedometer graph is a great tool to help visualize percentages, as well as other fixed-range amounts for end users. They can also be color coded (see below), so that certain ranges are categorized with different colors. Speedometers can even be used to graph multiple sets of data, with multiple needles pointing to your data. However, for this tutorial, we will focus on a single set of data.

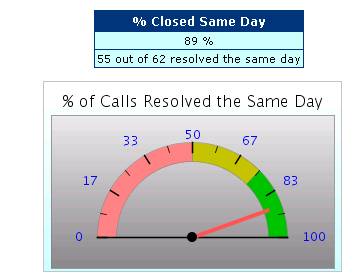
Below is an example of a speedometer where the data is a percentage (perfect for a pre-defined range from 0 to 100) of how many calls are resolved the same day. As the data fluctuates, so does the needle.

Setting up the speedometer is simple and will only take a few minutes.

  1. Generate, build, and compile a report as usual. Be sure to select the Report with Graph template.
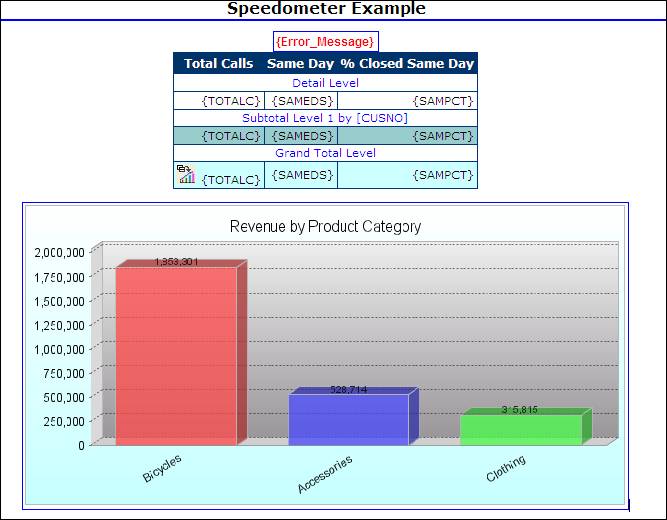
  2. Open m-Painter. You should see a screen similar to this:
  3. Right-click on the bar graph and select "Graph Properties".
  4. Select "Speedometer" from the "Other" tab.
  5. Click the "Fields" tab and drag the appropriate field to the right side.
  6. Click the "Levels" tab and select the "Grand Total Level".
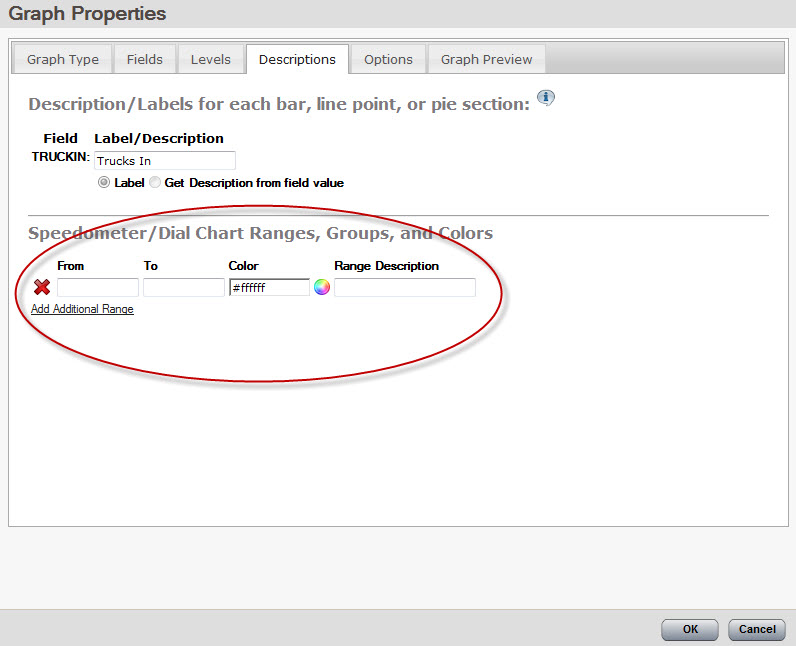
  7. Optional: Under the "Descriptions" tab, you can set ranges and color code each range.

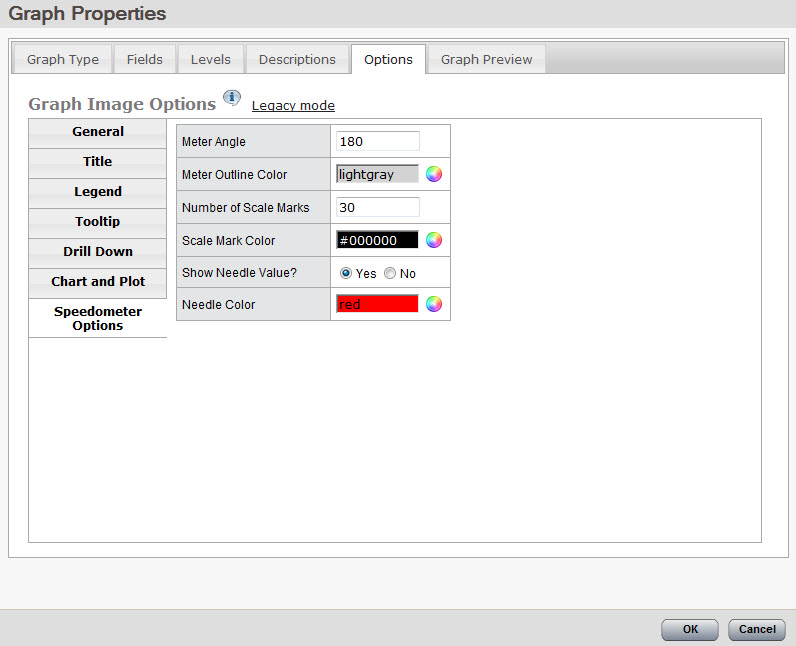
    Under the "Options" tab, there is a section titled "Speedometer Options". Here you can alter Speedometer-specific options such as the needle color, amongst other properties.

  8. Click "OK" & save.

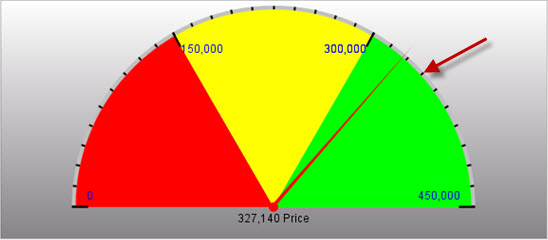
At run-time, you will see a graph similar to this:

Created: September 26, 2008 | Modified: June 12, 2017

Search


Browse By Category

Build Process (13)
Starting with m-Power (8)
Retrievals (10)
Reports (15)
Summaries (4)
Maintainers (17)
Graphs (8)
m-Power Data Explorer (4)
General (24)
Calculations (5)
Utilities (9)
m-Power Administration (23)
Security (11)
Freemarker (6)
m-Painter (29)
Form Validation (5)
External Objects & UDFs (12)
Deprecated Documentation (23)
Bootstrap Templates (7)

Popular Tags

App Properties Calculations Graphing Production Excel Prompt Screens Admin Bootstrap Templates Database Graph Properties Freemarker RPG Advanced Java Retrievals Retrieval Parameters Bar Graphs Graphs Dates Report Security Administration Data Dictionary m-Painter Performance Summaries Video Maintainer External Objects Popular Getting Started SQL Email Build Process Application Properties Form Validation mrc-Productivity Series Dropdowns Tomcat Maintainers DB2 Record Selections Compiling Reports

See all tags »

michaels, ross & cole, ltd. (mrc)

Privacy Policy Cookie Policy Cookie Settings Notice at Collection Do Not Sell or Share My Personal Information

mrc (US)

2001 Midwest Road
Suite 310
Oak Brook, IL 60523
630-916-0662

mrc (UK)

Mortlake Business Centre
20 Mortlake High Street
London, SW14 8JN
+44-20-335-59566


© 2024 mrc. All rights reserved.