mrc logo mrc logo
  • m-Power m-Power
    What is m-Power?
    Overview Demos Build Process Case Studies Specs Pricing Trial
    m-Power Resources
    Overview How-To Videos Webinars & Podcasts White Papers Fact Sheets
  • Solutions Solutions
    What does m-Power build?
    Overview Database Front-Ends Reporting CRM Systems Business Intelligence Dashboards Inventory Management Mobile Apps ERP Enhancements Modernization Spreadsheets to the web MS Access to the web B2B/Web Portals Scheduling Embedded Analytics Web Forms Workflow Data Exploration Budgeting & Forecasting APIs and Web Services Db2 Web Query Alternative
    Solutions by Industry
    Overview Manufacturing Government Foodservice Software Vendors Logistics & Supply Chain Software Consultants Healthcare
  • Services Services
    Development Services Training Mentoring
  • About About
    Overview Partners Press Releases Careers Events Contact Blog
  • Support Support
    Support Home FAQ Documentation Customer Portal Enhancements Updates Roadmap Techblog
Try m-Power

m-Power Manual

Browse:

  • Home
  • Graphs
  • Create a Stacked Bar Chart
Back to Manual

Stacked Bar Charts and Reports with Graphs


Stacked Bar Charts are useful tools when your data falls into similar groups. For instance, if you wanted to see the number of trucks leaving & arriving at a client you could simply group the data by client. However, in an order to conserve space, you could simply stack both values atop one another by using the Stacked Bar Chart graph.

The steps outlined below will demonstrate how this is done.

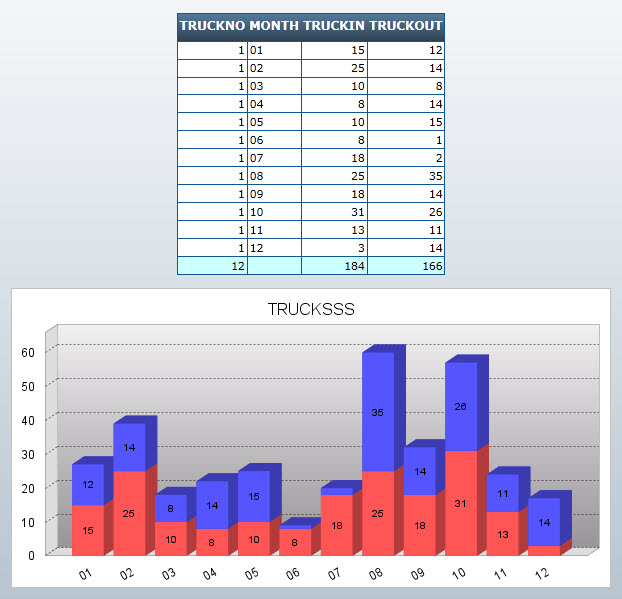
For the example below, we will be displaying truck activity, over 12 months, by "stacking" the drop-offs and pickups.

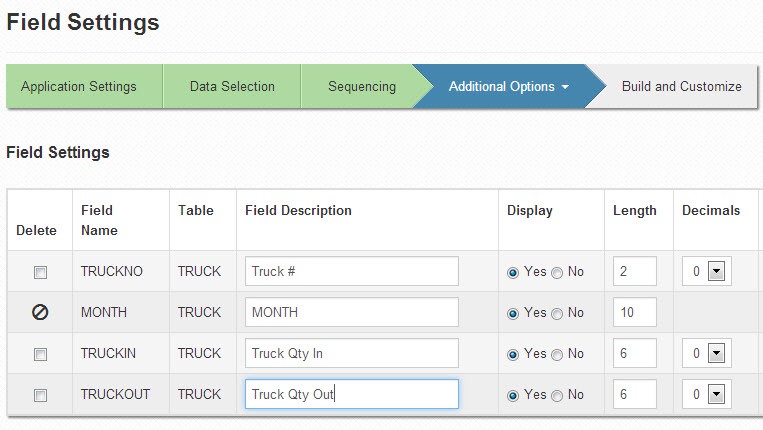
As you can see from this screenshot, we have four total fields:

After selecting a Report with Graph template, build the application and enter m-Painter.

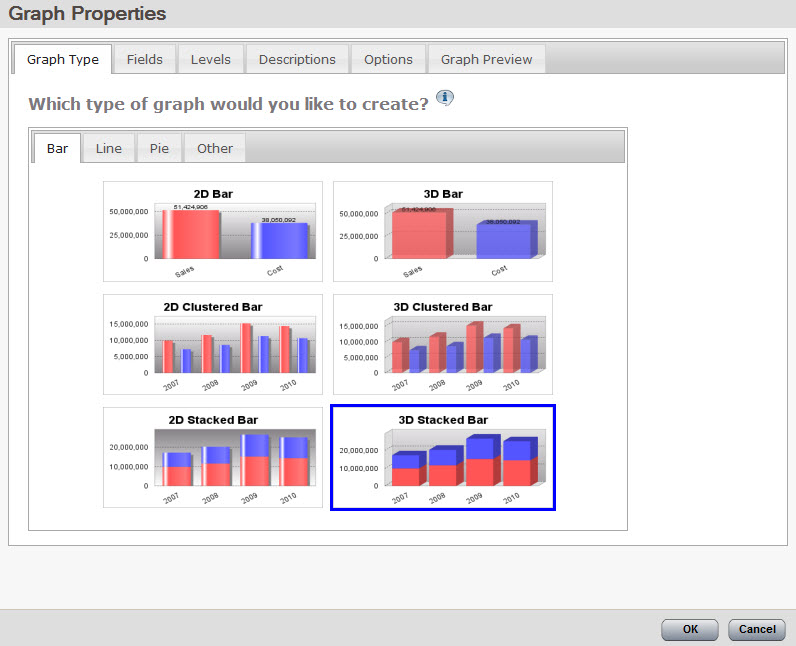
Right-click on the graph and select "Graph Properties". Select the "3D Stacked Bar" graph on the first tab.

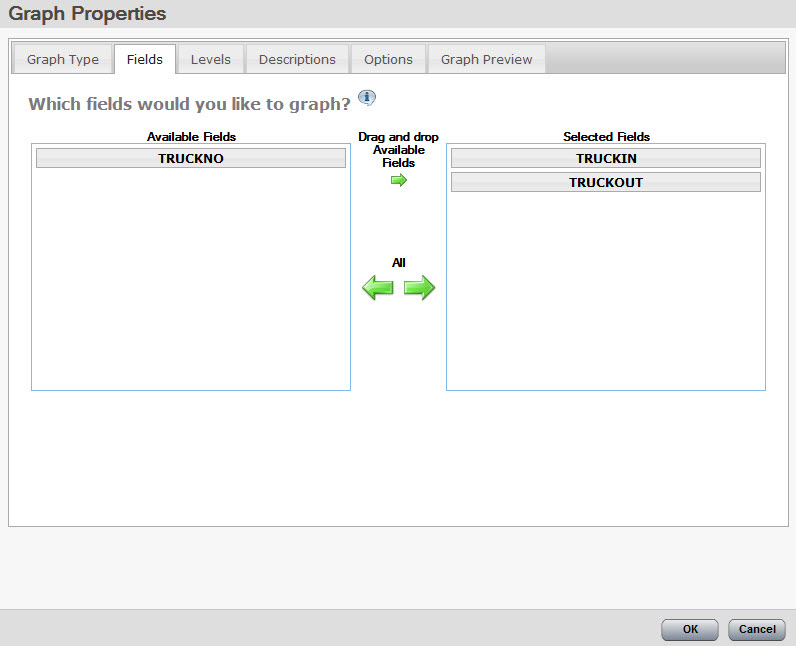
On the "Fields" tab, select "TRUCKIN" & "TRUCKOUT".

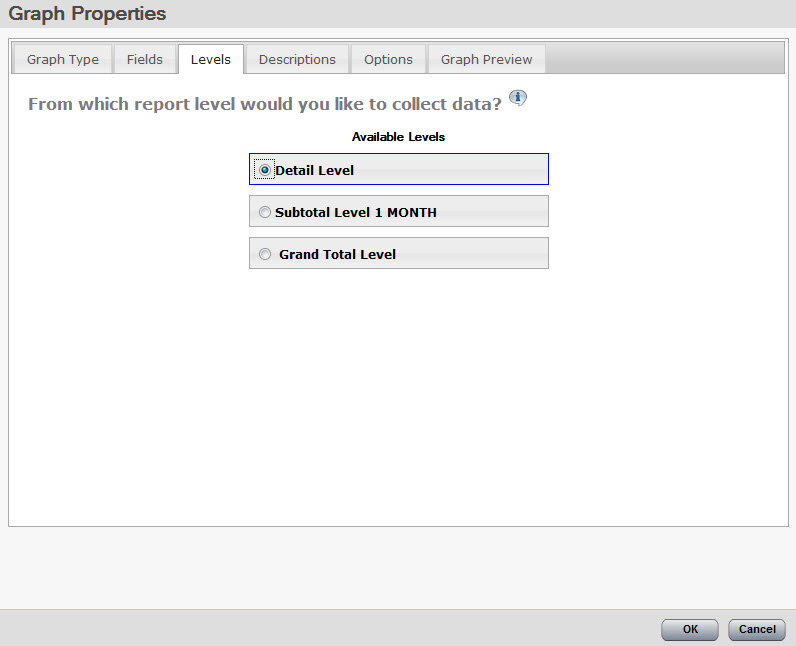
On the "Levels" tab, select "Detail Level".

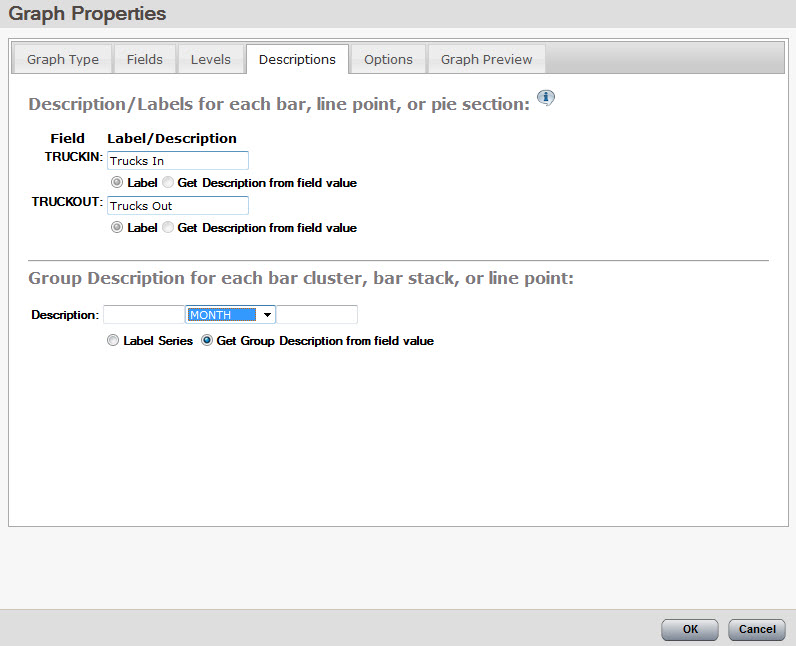
On the "Descriptions" tab, enter "Trucks In" for field "TRUCKIN" and "Trucks Out" for field "TRUCKOUT".

Lastly, specify the field "MONTH" as the "Group Description" value. Think of the "Group Description" value as the field that will make this graph unique.

Click "OK".

Save your application. At runtime, you graph will look like this:

Created: September 26, 2008 | Modified: May 7, 2012

Search


Browse By Category

Build Process (13)
Starting with m-Power (8)
Retrievals (10)
Reports (15)
Summaries (4)
Maintainers (17)
Graphs (8)
m-Power Data Explorer (4)
General (24)
Calculations (5)
Utilities (9)
m-Power Administration (23)
Security (11)
Freemarker (6)
m-Painter (29)
Form Validation (5)
External Objects & UDFs (12)
Deprecated Documentation (23)
Bootstrap Templates (7)

Popular Tags

Compiling Retrieval Bootstrap Templates Reports Application Properties App Properties Dates Administration Popular Tomcat Advanced Email Java Database Security RPG mrc-Productivity Series Parameters Performance Production DB2 Retrievals External Objects Form Validation Admin Calculations m-Painter Freemarker SQL Getting Started Record Selections Data Dictionary Build Process Maintainers Prompt Screens Report Excel Maintainer Summaries Graphs Video Bar Graphs Dropdowns Graph Properties Graphing

See all tags »

michaels, ross & cole, ltd. (mrc)

Privacy Policy Cookie Policy Cookie Settings Notice at Collection Do Not Sell or Share My Personal Information

mrc (US)

2001 Midwest Road
Suite 310
Oak Brook, IL 60523
630-916-0662

mrc (UK)

Mortlake Business Centre
20 Mortlake High Street
London, SW14 8JN
+44-20-335-59566


© 2024 mrc. All rights reserved.