Date Period Analysis
The period analysis tool allows end-users the ability to quickly choose from a list of pre-set date values to filter reports. Common values include dates such as 'today', 'yesterday', and 'this week' to more complicated date ranges such as 'last month to date' and 'last fiscal quarter'. Additionally, end-users are given the ability to easily compare two different date ranges against each other.
Jump to:
Comparing Dates
Web Parameters
Additional Notes
Getting Started
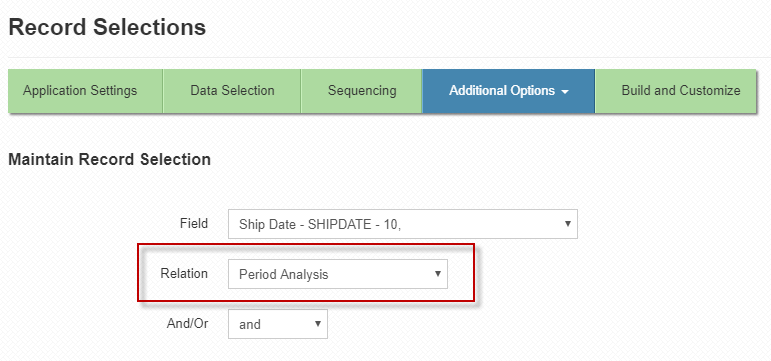
When a true date field is selected as a record selection, specific date related relationships become available. To allow the end-user to perform runtime period analysis, select 'Period Analysis' as the relation.
At runtime, the end-user is given full command of filtering and/or comparing dates.
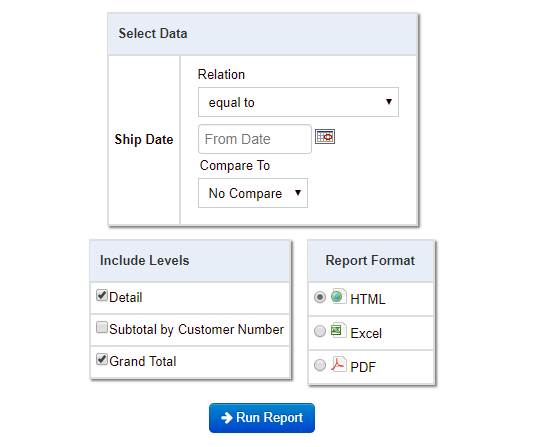
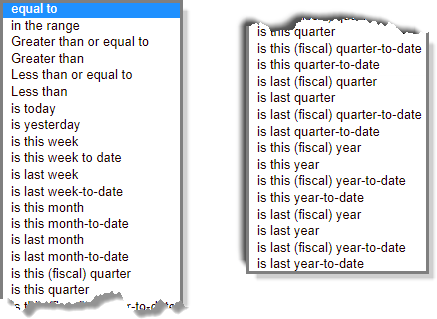
The most basic use of this tool is to simply filter the data based on a common date. Aside from the manual date selection of 'Equal to' or 'In the range', the relation dropdown has many built-in options for common date values.
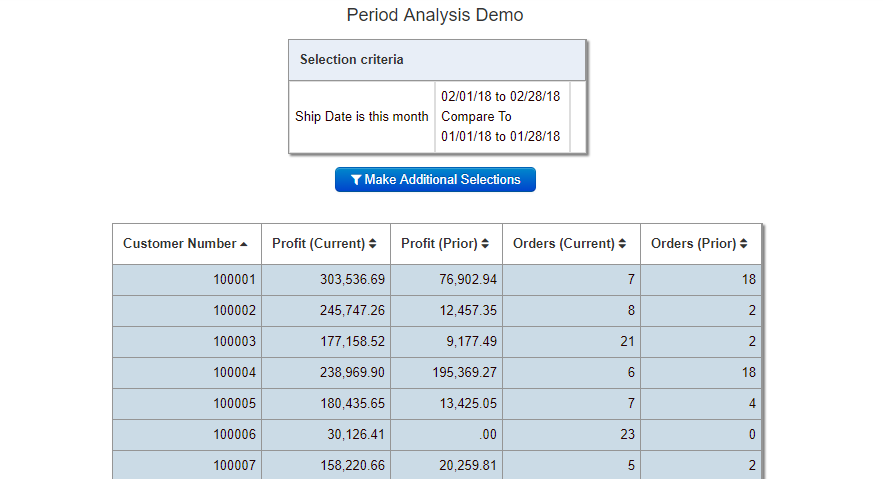
Comparing Dates
Comparison options include Prior Period, Prior Year, and Custom Range (a fourth option called Prior Year Adjusted can be added by following these instructions here). If a user has selected data from this month, and chooses to compare to the previous period, all numeric fields will display two columns. One column contains the data for this month (current period) and the other column will hold data for last month (prior period). The same can be expected for previous year and a custom range.
URL Web Parameters
Like all other report prompt options, the period analysis tool can be passed to the report via URL parameters. This becomes especially relevant when using reports in the messaging and scheduled task utility as well as using reports in dashboard.
- compareOn: Set the option to compare against.
Available values: period, custom, year, prior-adjusted
- rls_RXXX: Set the date relationship value.
Available values:
EQ: equal to
RG: in the range
GE: Greater than or equal to
GT: Greater than
LE: Less than or equal to
LT: Less than
D1: is today
D2: is yesterday
W1: is this week
W2: is this week to date
W3: is last week
W4: is last week-to-date
M1: is this month
M2: is this month-to-date
M3: is last month
M4: is last month-to-date
Q1: is this (fiscal) quarter
Q5: is this quarter
Q2: is this (fiscal) quarter-to-date
Q6: is this quarter-to-date
Q3: is last (fiscal) quarter
Q7: is last quarter
Q4: is last (fiscal) quarter-to-date
Q8: is last quarter-to-date
Y1: is this (fiscal) year
Z1: is this year
Y2: is this (fiscal) year-to-date
Z2: is this year-to-date
Y3: is last (fiscal) year
Z3: is last year
Y4: is last (fiscal) year-to-date
Z4: is last year-to-date - RXXX: Set the manual date value if the relationship above does not set the date already.
Available values: Any valid date value. Note: If the relationship is set to RG, two RXXX values will be needed.
- compVal1/compVal2: Applicable and required only if using a custom comparison. Set the custom date range values for the start date (compVal1) and end date (compVal2).
Available values: Any valid date values.
- Examples:
compareOn=period&rls_R001=D1
Display data from today compared to yesterday.
compareOn=period&rls_R001=RG&R001=01/15/2018&R001=01/18/2018
Display data from a date range of 01/15/2018 – 01/18/2018 compared to 01/11/2018 – 01/14/2018.
compareOn=year&rls_R001=Y1
Display data from this year compared to last year.
compareOn=year&rls_R001=RG&R001=01/15/2018&R001=01/18/2018
Display data from a date range of 01/15/2018 – 01/18/2018 compared to 01/15/2017 – 01/18/2017.
compareOn=custom&rls_R001=M2&compVal1=01/20/2018&compVal2=01/26/2018
Display data from this month-to-date compared to 01/20/2018 – 01/26/2018.
- The heading text representing the (Current) and (Prior) columns may be changed from Admin Menu -> Edit Dictionary Files -> Servlet Properties. Find the options for 'Prior period column label' and 'Current period column label'. Recompile your application (you do not need to overwrite the HTML) to see the change.
- Fiscal dates are determined from the 'fiscal_month' setting in the mrcjava/WEB-INF/classes/mrc_runtime.properties file found on the m-Power server (i.e. fiscal_month=5). Tomcat needs to be restarted after the file change. This file will need to be promoted to production as well.
- This feature only supports true date fields. If wanting to use a datetime field, you will need to have a calculation created to convert the datetime to a date only field. For example; MSSQL database: CONVERT(DATE, [FIELD_HERE]). Use the new calculation as the record selection field.
- Period Analysis is supported in the following templates: Web 2.0 Report, Web 2.0 Report with Graph, OLAP Pivot Table, and the Interactive Report.