The full m-Power chart library

m-Power ships a broad library of chart and graph types, from everyday bar and line charts to funnel, waterfall, radar, and Pareto. Add any of them to an application in m-Painter, where each chart reads from your live database.

One library, every application

Pick the chart that fits the question you're answering. Every type in this library reads from the database the application runs over, so the graph reflects the current numbers instead of a stale export.

30+ chart types

Bar, line, pie, gauge, funnel, radar, waterfall, and combination charts, ready to drop into an application.

Added in m-Painter

Choose the type, then position and style the chart visually, with no coding required to get started.

Built on live data

Each chart draws from the application's database, so it stays current as the data changes.

The full gallery

Browse the chart and graph types

A representative look at the library. Need a type you don't see here? Ask us, and we'll show you what's possible.
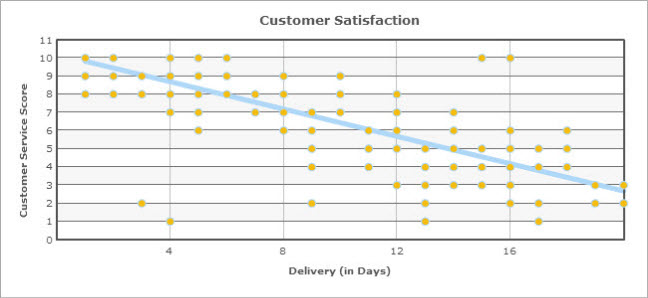
Scatter chart built with m-Power
Scatter chart
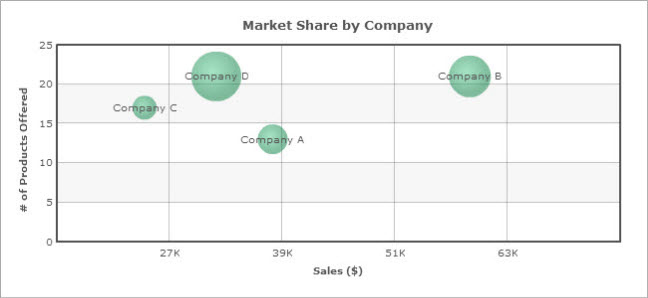
Bubble chart built with m-Power
Bubble chart
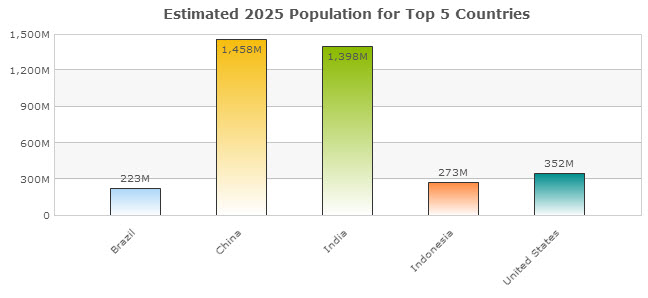
2D bar chart built with m-Power
2D bar chart
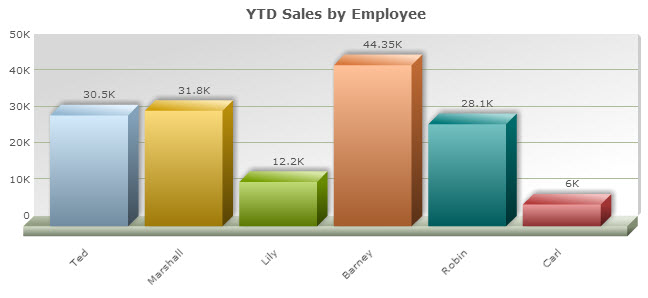
3D bar chart built with m-Power
3D bar chart
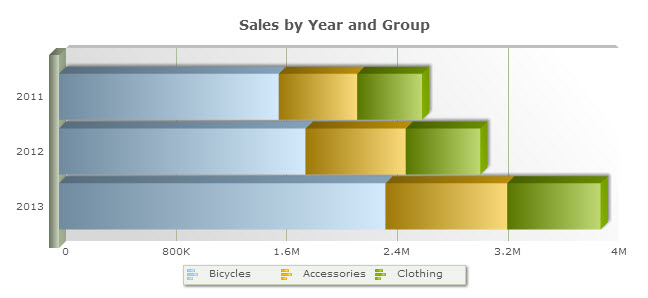
Horizontal bar chart, 3D built with m-Power
Horizontal bar chart, 3D
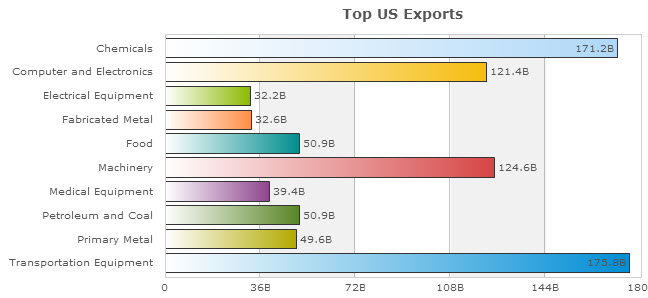
Horizontal bar chart, 2D built with m-Power
Horizontal bar chart, 2D
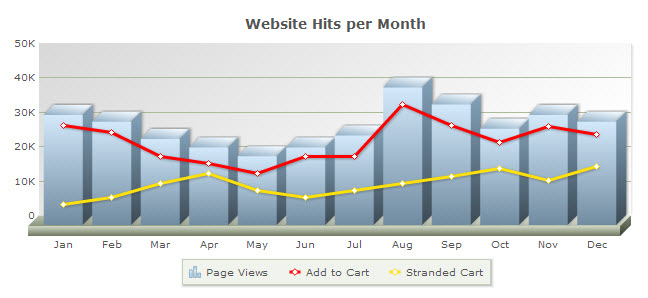
Multi line and bar combo built with m-Power
Multi line and bar combo
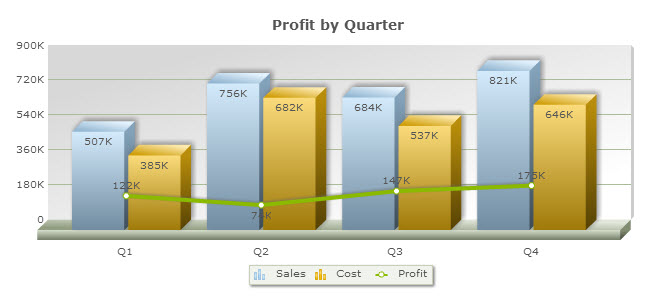
Multi bar and line combo built with m-Power
Multi bar and line combo
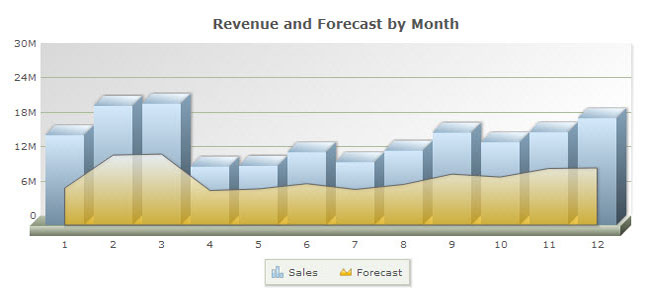
Bar and area combo built with m-Power
Bar and area combo
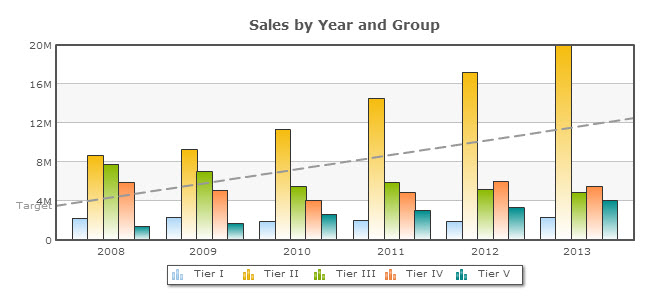
Multi-bar with target built with m-Power
Multi-bar with target
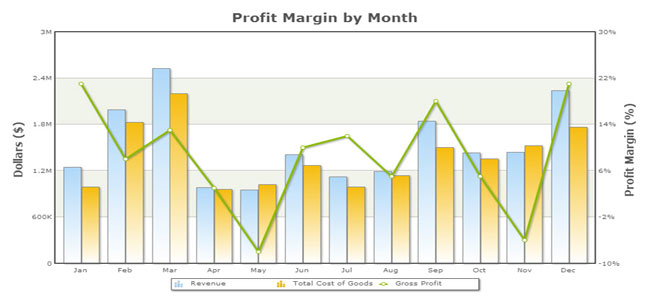
Dual Y axis combo built with m-Power
Dual Y axis combo
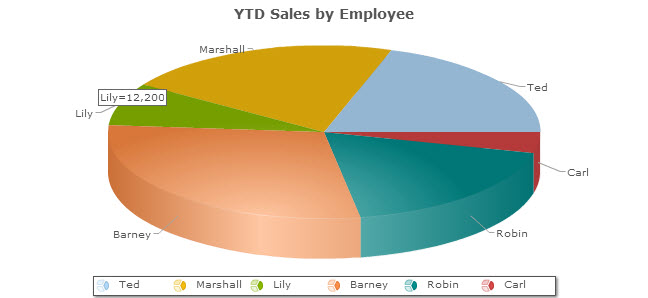
3D pie chart built with m-Power
3D pie chart
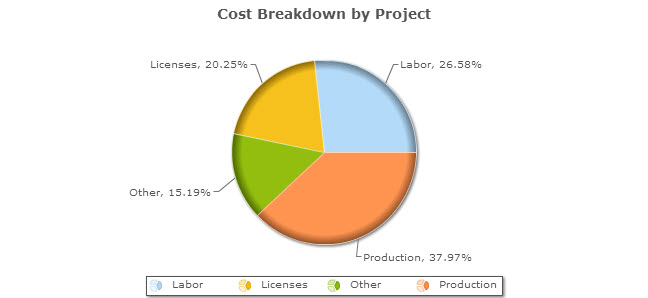
2D pie chart built with m-Power
2D pie chart
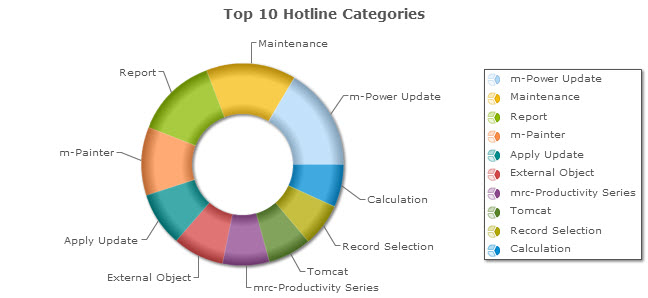
2D doughnut chart built with m-Power
2D doughnut chart
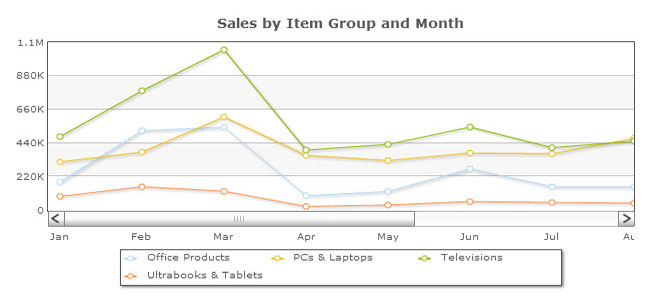
Scrolling line chart built with m-Power
Scrolling line chart
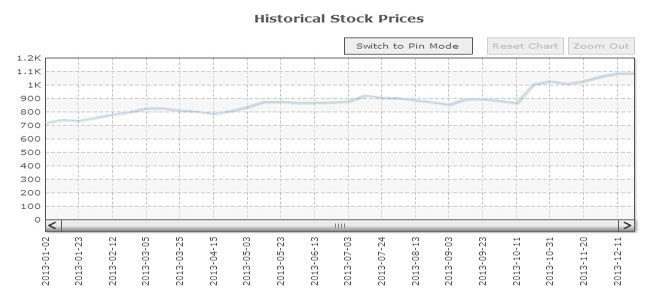
Zoom line chart built with m-Power
Zoom line chart
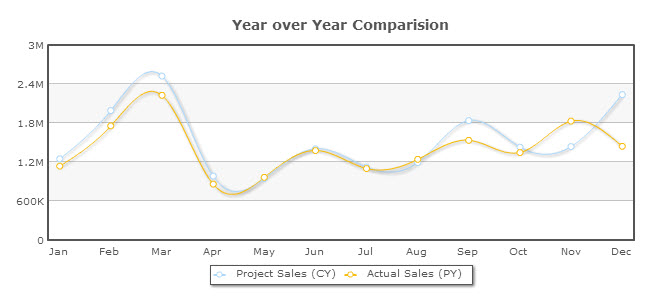
Spline line chart built with m-Power
Spline line chart
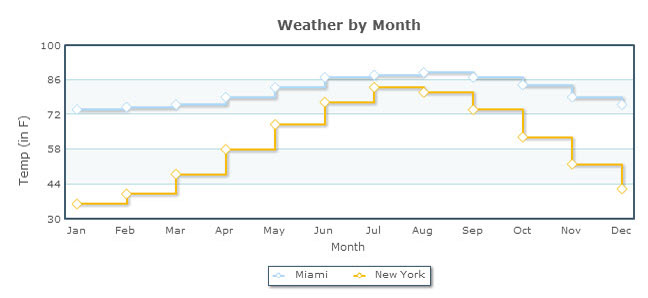
Step line chart built with m-Power
Step line chart
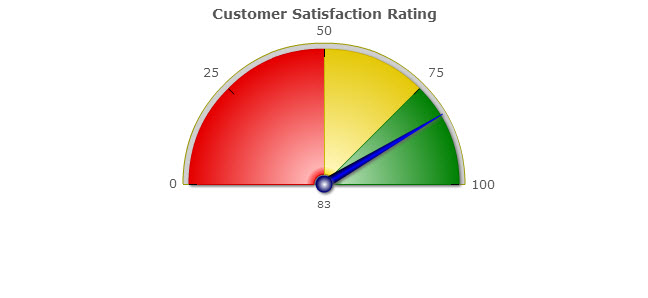
Speedometer chart built with m-Power
Speedometer chart
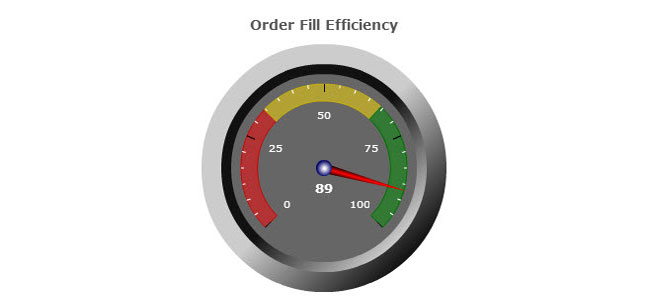
Dial chart built with m-Power
Dial chart
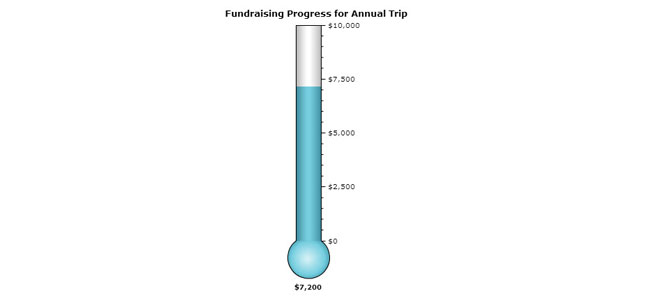
Thermometer chart built with m-Power
Thermometer chart
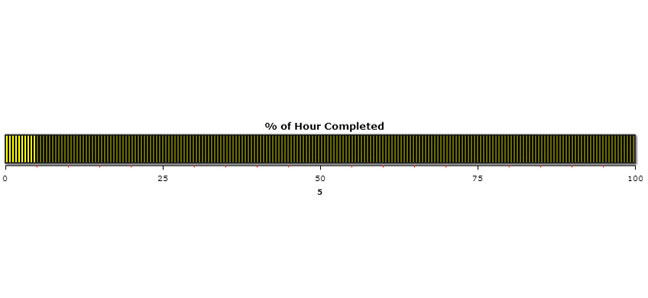
LED gauge chart built with m-Power
LED gauge chart
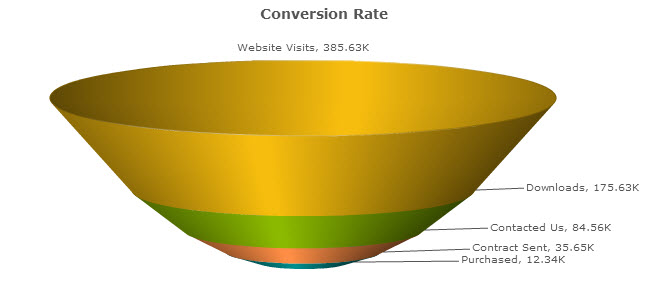
Funnel chart built with m-Power
Funnel chart
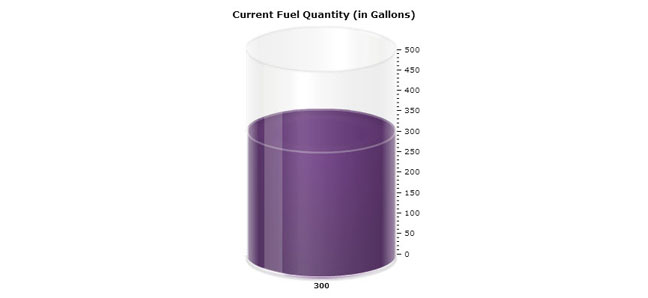
Cylinder chart built with m-Power
Cylinder chart
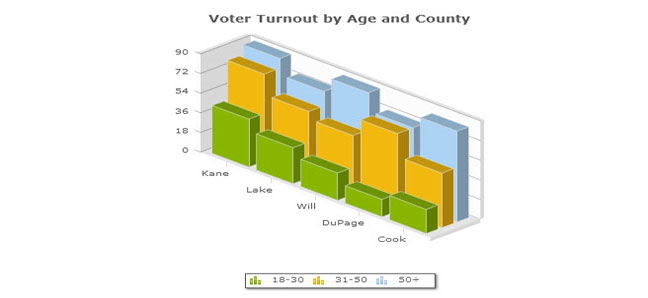
3D combo graph built with m-Power
3D combo graph
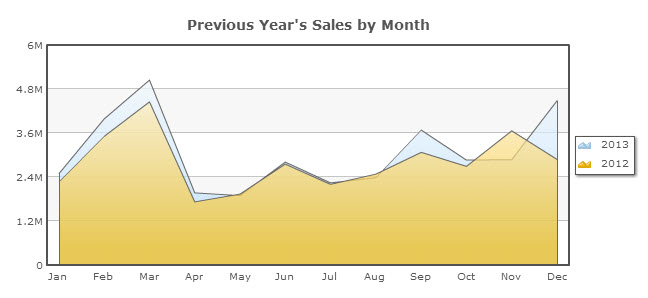
Area chart built with m-Power
Area chart
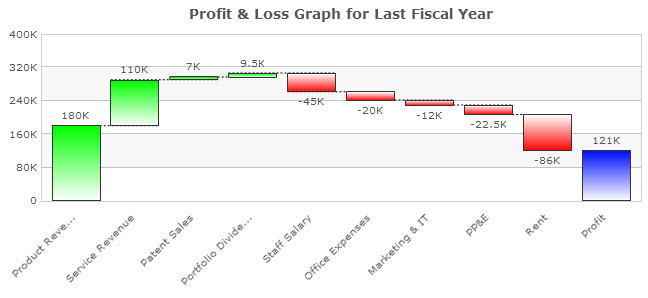
Waterfall chart built with m-Power
Waterfall chart
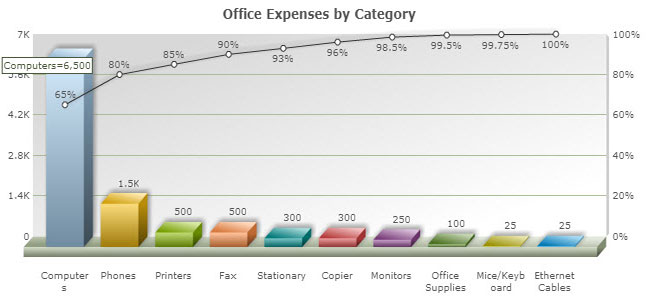
Pareto 80/20 chart built with m-Power
Pareto 80/20 chart
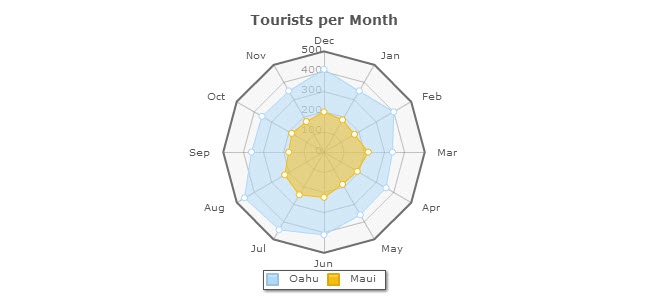
Radar and spider chart built with m-Power
Radar and spider chart
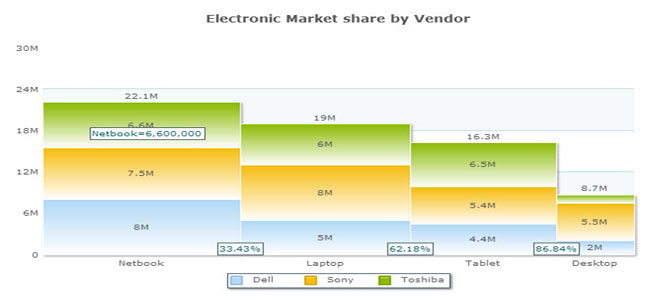
Marimekko chart built with m-Power
Marimekko chart
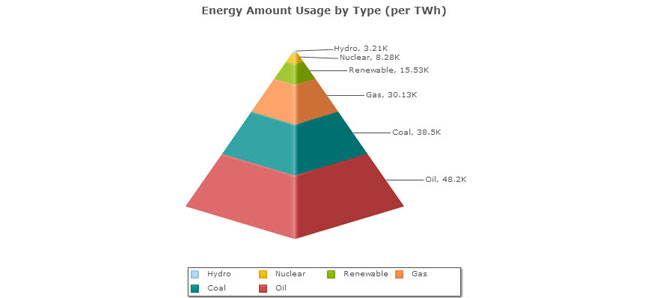
Pyramid chart built with m-Power
Pyramid chart

There are very few instances I've run into with m-Power where I'm hitting a brick wall and the software itself is a limiter. There's very little we can't do with it. Our imagination is the only limiter.

Case Escher, Employee Services Consultant, The Partners Group

Questions about the chart library

Don't see yours? Ask us. You'll get an answer from someone who builds with m-Power every day.

Send us a note

Page updated July 2026

How many chart types can m-Power build?

m-Power supports a wide library of chart and graph types, including bar, column, line, spline, area, pie, doughnut, gauge, funnel, pyramid, waterfall, Pareto, radar, and combination charts. The gallery on this page shows a representative set.

You add charts and graphs in m-Painter, m-Power's visual designer. You can add a chart to any application, choose the type, and style it without leaving the designer.

Charts read from the same database the application is built over, so they reflect your live data. When the underlying data changes, the chart reflects it.

Yes. The library includes combination charts, such as bar-and-line, bar-and-area, and dual Y-axis combos, so you can plot related measures together in a single graph.
See it for yourself

See the chart library built over your data

We'll walk through m-Power live, using your data and your use case, and show how any of these charts fit into a working application.