
m-Power chart and graph demos
Here are a few of the charts and graphs you can build with m-Power and add to any application. Each one reads from your live database, so the picture updates as the data does. Add them in m-Painter, m-Power's visual designer, with no coding required.
Charts that live on your data, not a spreadsheet export
A chart in m-Power is part of the application, drawn from the same database the application runs over. That means less copy-and-paste reporting and a picture that stays current. Here's what that looks like.
Built on live data
Charts read from the database the application is built over, so they reflect the current numbers.
Added in m-Painter
Drop a chart into any application with m-Painter, m-Power's visual designer, and style it without writing code.
Yours to customize
Change the type, colors, and labels visually, or open the code and take it further when you want.
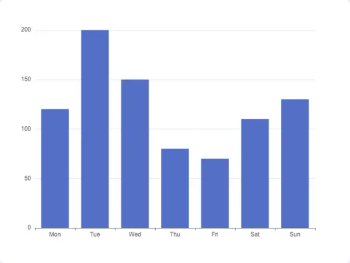
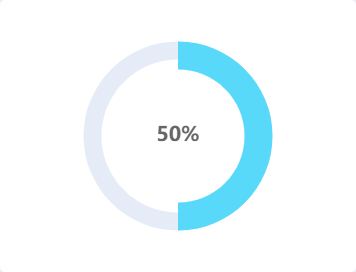
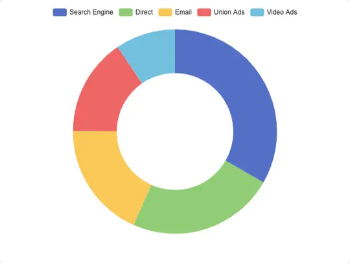
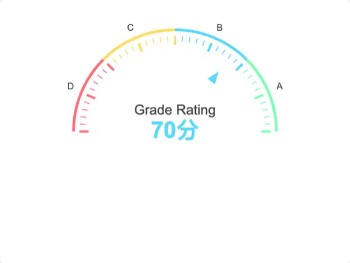
A sampling of chart and graph types
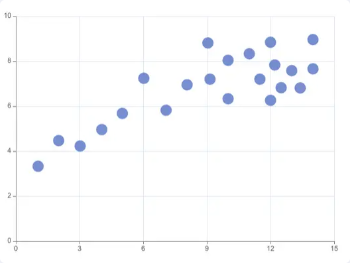
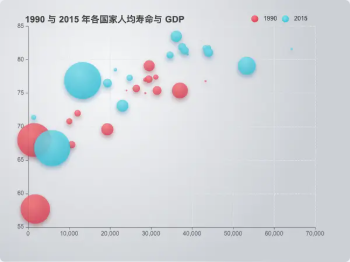
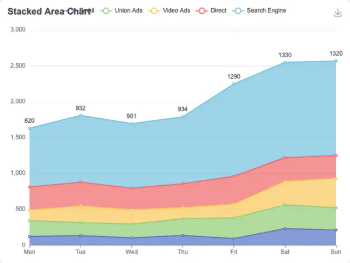
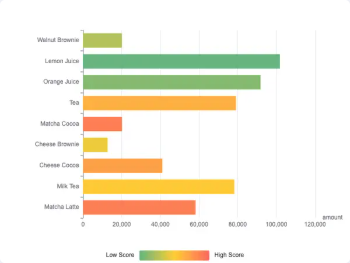
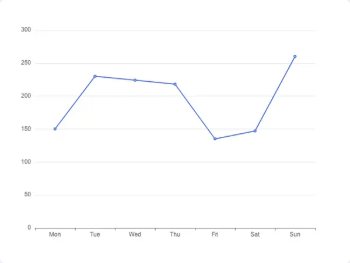
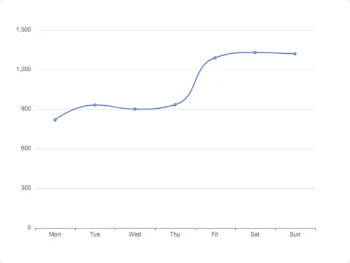
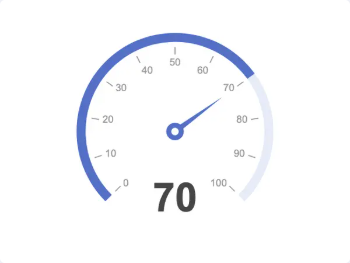
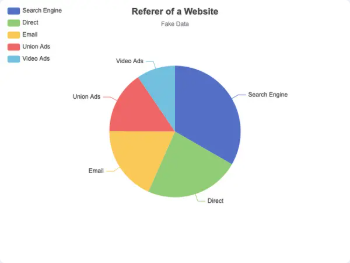
These are a few of the styles you can build. Want a type you don't see here? Ask us, or take a look at the full chart library.
Questions about charts
Don't see yours? Ask us. You'll get an answer from someone who builds with m-Power every day.
Send us a notePage updated July 2026
How do I add a chart to an m-Power application?
Where does the chart data come from?
Do I need to write code to build a chart?
Can I customize how a chart looks?
See these charts built over your data
We'll walk through m-Power live, using your data and your use case, and show how charts fit into a working application.