
How to Build AI Data Analytics Over Your Database
Report queues grow faster than most IT teams can clear them. This video shows how to build AI-powered data analytics over your existing database with the m-Power Development Platform. Users type a question, get an answer pulled from live data, and turn the results into charts, while IT decides exactly what data the AI can reach.
What you'll learn
This video sets up an AI analyst over a live order database, then puts it to work. Here is what you'll see:
Type a question, get an answer
Users type a question and the analyst answers it from live database data. No report request in between.
Charts built on request
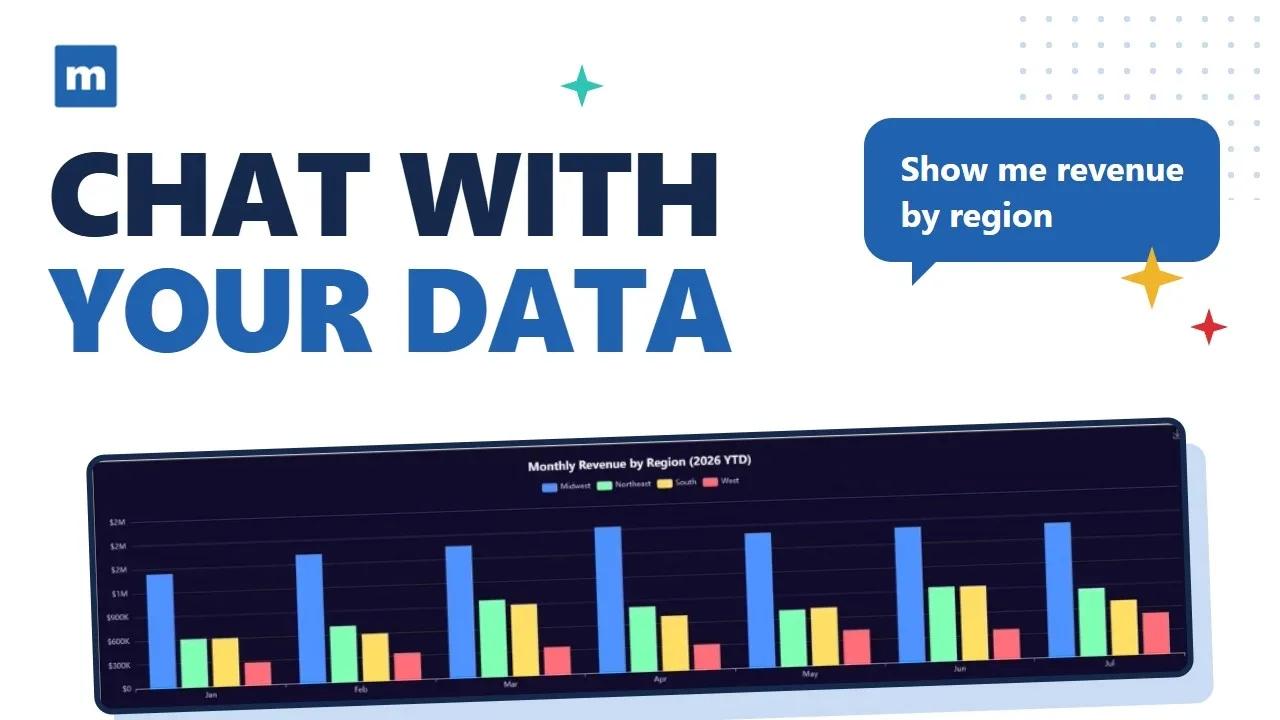
Ask for a chart and it gets drawn from the query results, with one click to switch between views like a trend line and a grouped bar chart.
Trend callouts with the numbers
The analyst points out what stands out in the results: Peaks, dips, and regions trending up or down over the year.
Knows the limits of the data
The analyst flags things like a partial month, so a half-finished August doesn't look like a slump.
You choose the data it sees
The assistant queries only the tables you allow, under the same security model as your other m-Power applications.
Runs on the model you pick
Connect the LLM your company approves, open or self-hosted, and swap it later without rebuilding the analyst.
See what an AI analyst could do over your database
We'll walk through m-Power live, using your data and your use case, and answer any questions your team has.