
The m-Power Data Explorer (DX)
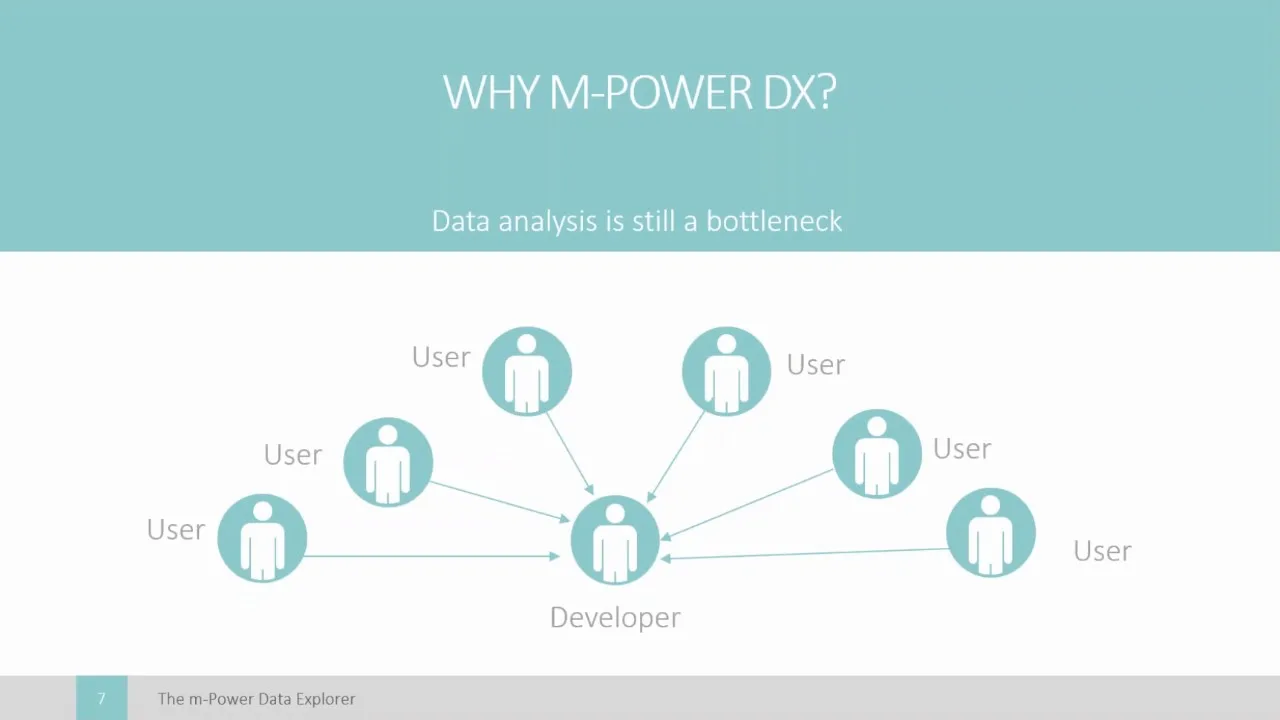
Every reporting request that reaches IT is a small tax on somebody's week. m-Power DX is an add-on that hands that work to the people asking for it: They build their own reports, data lookups, visualizations, pivot tables, and dashboards in minutes.
What we covered
A live demo of m-Power DX, about 38 minutes. Here is what it covers:
Self-service that IT does not have to staff
End users build reports, lookups, visualizations, pivot tables, and dashboards themselves, so routine requests stop landing in your queue.
A live demo, not a feature list
m-Power DX running against real data, so you can see what your users would actually be handed.
Pivot tables and user-defined dashboards
Two of the applications from the session are live below, including a pivot table and a dashboard each user can lay out themselves.
The demo applications from the webinar
Both were built in m-Power and both are live. Open them and click around the way one of your users would.
User-defined dashboard
Each user picks the data on their dashboard and controls the look and feel.
Pivot table report
Examine any aspect of the data, make comparisons, and spot trends without asking for a new report.
See what your users could build for themselves
We'll walk through m-Power live, using your data and your use case, and answer any questions your team has.