Skip to Content mrc logo mrc logo
  • What is m-Power?
    Overview Demos Build Process Case Studies Specs Pricing Trial
    m-Power Resources
    Overview How-To Videos Webinars & Podcasts White Papers Fact Sheets
  • What does m-Power build?
    Solutions by Industry
    Overview Database Front-Ends AI Reporting CRM Systems Business Intelligence Dashboards Inventory Management Mobile Apps ERP Enhancements Modernization
    Spreadsheets to the Web MS Access to the Web B2B/Web Portals Scheduling Embedded Analytics Web Forms Workflow Data Exploration Budgeting & Forecasting APIs & Web Services Db2 Web Query Alternative
    Solutions by Industry
    Overview Manufacturing Government Foodservice Software Vendors Logistics & Supply Chain Software Consultants Healthcare
  • Development Services Training Mentoring
  • Overview Partners Press Releases Careers Events Contact Blog
  • Support Home FAQ Documentation Customer Portal Enhancements Updates Roadmap Techblog
Try m-Power

m-Power Manual

Browse:

  • Home
  • Graphs
  • Options Tab
  • Chart-type Specific Options
  • 2D Stacked Bar Options Tab
Back to Manual

2D Stacked Bar Options Tab


  • Learn more about each tab:

    • Graph Type Tab
    • Fields Tab
    • Levels Tab
    • Descriptions Tab
    • Options Tab:

      • General Tab
      • Title Tab
      • Legend Tab
      • Tooltip Tab
      • Drilldown Tab
      • Chart/Plot Tab
      • Chart Type-Specific Options:

        • 2D Bar Chart Options Tab
        • 3D Bar Chart Options Tab
        • 2D Clustered Bar Options Tab
        • 3D Clustered Bar Options Tab
        • 2D Stacked Bar Options Tab
        • 3D Stacked Bar Options Tab
        • Single-Line Chart Options Tab
        • Multi-Line Chart Options Tab
        • 2D Pie Options Tab
        • 3D Pie Options Tab
        • Speedometer Options Tab
        • Dial Chart Options Tab
           

This tab provides options specific to the 2D Stacked Bar Chart.

X/Y Axis Label Tab

This tab governs the text label on the X and Y Axes:
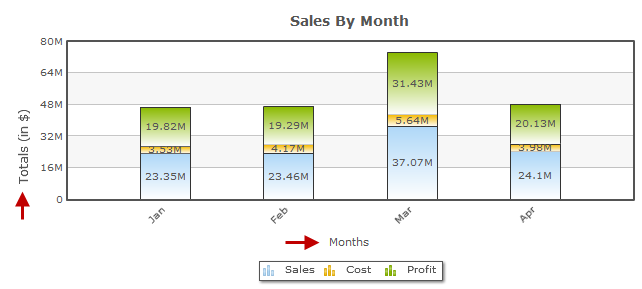
Add a label by typing a name in the X/Y Axis Label field. This will be the title for that label. In the above example, the X axis label is "Months", and the Y axis label is "Total (in $)".

The font settings for the text of the label can be modified using these fields:

X/Y Axis Label Font

Available Fonts are Helvetica, Arial, Times New Roman, Tahoma, and Sans-Serif. Sans-Serif will make the font be whatever the browser's default Sans-Serif font is.

X/Y Axis Label Font Style

This setting will make the font Bold, Italic, both, or normal. The default "Normal" will leave the text without bold or italics.

X/Y Axis Label Font Size

The font size can be raised or lowered here. By default it is set to 10 pt.

X/Y Axis Label Font Color

The font color may be a 6-digit hexadecimal value. Alternatively, you can click on the color wheel next to the text field to pick a color from a palette.

X/Y Axis Label Margins

This setting controls the amount of space around the axis label. Units are in pixels, and the order is top, left, bottom, right.

X Axis Item Label Tab

This tab gives options for the labels of each bar on the X axis of the chart:
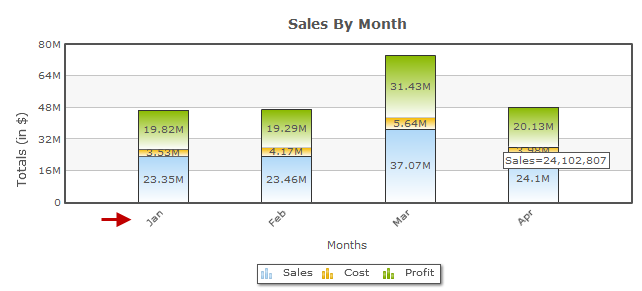
The angle of the labels can be modified by changing the X Axis Item Label Rotation. Units are in degrees. Perfectly horizontal is 0 degrees, perfectly vertical is 90 or 270 degrees.

The font of the labels may be edited with the Font, Style, Size, and Color settings. Explanations for each setting are noted above in reference to the X/Y Axis Label.

Y Axis Scale Tab

This tab deals with the numeric labels along the Y axis.
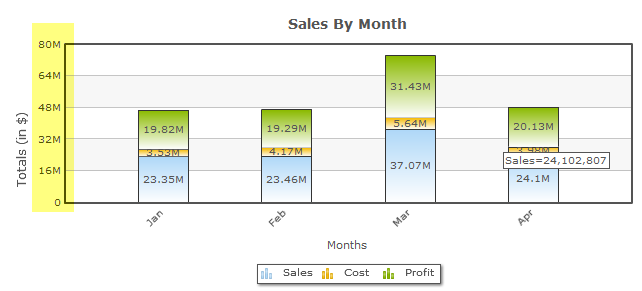
The font settings may be modified as noted above in the X/Y Axis Label Tabs.

By default, the Y-Axis scale lines are turned on. To turn them off, set Display Y Axis Grid Lines to "No".
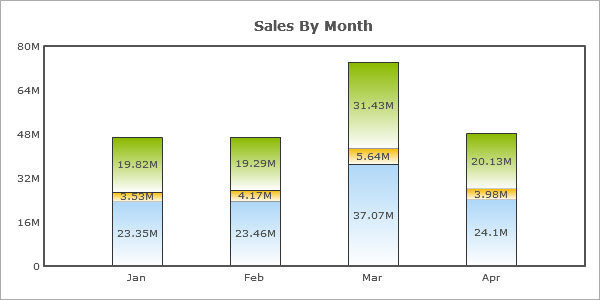
The next two values set the scale of the graph. When these are set to zero, the scale varies to match the values of the graph. To fix the upper and lower limit, enter the values into the Y Axis Upper/Lower Boundary. The example below is with the upper boundary set to 380,000,000 and the lower boundary set at -10,000,000.
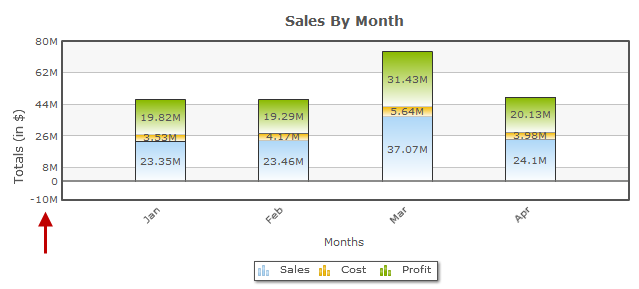
The final value sets the distance between the scale markings on the graph.

Created: January 5, 2011 | Modified: February 12, 2014

Search


Browse By Category

Build Process (13)
Starting with m-Power (8)
Retrievals (10)
Reports (15)
Summaries (4)
Maintainers (17)
Graphs (8)
m-Power Data Explorer (4)
General (24)
Calculations (5)
Utilities (9)
m-Power Administration (23)
Security (11)
Freemarker (6)
m-Painter (29)
Form Validation (5)
External Objects & UDFs (12)
Deprecated Documentation (23)
Bootstrap Templates (7)

Popular Tags

Record Selections Application Properties Retrieval Dates Email Dropdowns Calculations External Objects Graphs Popular mrc-Productivity Series Java SQL DB2 Graphing Video Form Validation Maintainers Performance Prompt Screens App Properties Freemarker Maintainer Advanced Bootstrap Templates Reports Administration Compiling Graph Properties Admin RPG Database Retrievals m-Painter Bar Graphs Summaries Build Process Production Getting Started Report Security Parameters Excel Data Dictionary Tomcat

See all tags »

mrc

Build the custom apps and AI tools your business needs with m-Power, or have our Chicago-based team build them with you. One platform, one team that makes sure you succeed.

Since 1981 · 1,500+ customers · 4.7/5 on G2

m-Power
Overview Demos Build Process Licensing Specs Get a Demo
Solutions
Database Front-Ends Reporting AI Tools Dashboards ERP Enhancements Modernization See all solutions
Company
Case Studies Services About Blog Careers Contact Support

Privacy Policy Cookie Policy Cookie Settings

michaels, ross & cole, ltd. (mrc)
US: 2001 Midwest Road, Suite 310, Oak Brook, IL 60523 · 630-916-0662
UK: Mortlake Business Centre, 20 Mortlake High Street, London, SW14 8JN · +44-20-335-59566
© mrc. All rights reserved.