Skip to Content mrc logo mrc logo
  • What is m-Power?
    Overview Demos Build Process Case Studies Specs Pricing Trial
    m-Power Resources
    Overview How-To Videos Webinars & Podcasts White Papers Fact Sheets
  • What does m-Power build?
    Overview Database Front-Ends Reporting CRM Systems Business Intelligence Dashboards Inventory Management Mobile Apps ERP Enhancements Modernization Spreadsheets to the Web MS Access to the Web B2B/Web Portals Scheduling Embedded Analytics Web Forms Workflow Data Exploration Budgeting & Forecasting APIs & Web Services Db2 Web Query Alternative
    Solutions by Industry
    Overview Manufacturing Government Foodservice Software Vendors Logistics & Supply Chain Software Consultants Healthcare
  • Development Services Training Mentoring
  • Overview Partners Press Releases Careers Events Contact Blog
  • Support Home FAQ Documentation Customer Portal Enhancements Updates Roadmap Techblog
Try m-Power

m-Power Manual

Browse:

  • Home
  • Graphs
  • Options Tab
  • Chart-type Specific Options
  • 2D Pie and Doughnut Options Tab
Back to Manual

2D Pie and Doughnut Chart Options Tab


  • Learn more about each tab:

    • Graph Type Tab
    • Fields Tab
    • Levels Tab
    • Descriptions Tab
    • Options Tab:

      • General Tab
      • Title Tab
      • Legend Tab
      • Tooltip Tab
      • Drilldown Tab
      • Chart/Plot Tab
      • Chart Type-Specific Options:

        • 2D Bar Chart Options Tab
        • 3D Bar Chart Options Tab
        • 2D Clustered Bar Options Tab
        • 3D Clustered Bar Options Tab
        • 2D Stacked Bar Options Tab
        • 3D Stacked Bar Options Tab
        • Single-Line Chart Options Tab
        • Multi-Line Chart Options Tab
        • 2D Pie Options Tab
        • 3D Pie Options Tab
        • Speedometer Options Tab
        • Dial Chart Options Tab
           

This tab provides options specific to the 2D Pie Chart and Doughnut Chart. These two charts are nearly identical in logic.

Pie Label/Tooltip Value Format

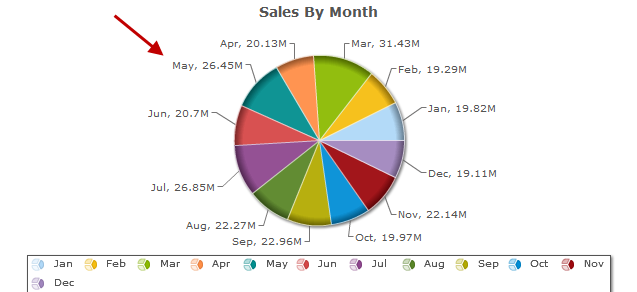
The Pie Label/Tooltip Value Formats define what values are displayed on the label (circled in blue) and the tooltip (circled in red).

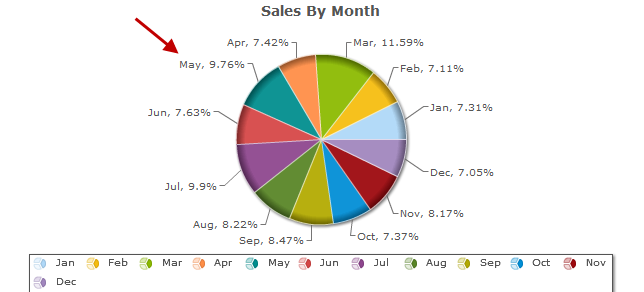
There are three values that may be used in the format, the description from the description tab (displayed by entering "{0}"), the numeric value of the pie piece (displayed by entering "{1}"), and that piece's percentage of the pie (displayed by entering "{2}"). In the example below, the Pie Label Value Format is "{0}" and the Pie Tooltip Label Format is "{1}={2}".

Created: January 5, 2011 | Modified: February 12, 2014

Search


Browse By Category

Build Process (13)
Starting with m-Power (8)
Retrievals (10)
Reports (15)
Summaries (4)
Maintainers (17)
Graphs (8)
m-Power Data Explorer (4)
General (24)
Calculations (5)
Utilities (9)
m-Power Administration (23)
Security (11)
Freemarker (6)
m-Painter (29)
Form Validation (5)
External Objects & UDFs (12)
Deprecated Documentation (23)
Bootstrap Templates (7)

Popular Tags

App Properties Dropdowns Summaries Graph Properties Record Selections Maintainer Reports Java Application Properties RPG Retrieval Data Dictionary Administration Compiling Dates Graphs Security Database Report External Objects Tomcat Freemarker Production Video Graphing Popular SQL Performance Excel Parameters Getting Started Bootstrap Templates Prompt Screens Admin DB2 Bar Graphs Calculations Retrievals mrc-Productivity Series Advanced Email Maintainers Form Validation Build Process m-Painter

See all tags »

michaels, ross & cole, ltd. (mrc)

Privacy Policy Cookie Policy Cookie Settings Notice at Collection Do Not Sell or Share My Personal Information

mrc (US)

2001 Midwest Road
Suite 310
Oak Brook, IL 60523
630-916-0662

mrc (UK)

Mortlake Business Centre
20 Mortlake High Street
London, SW14 8JN
+44-20-335-59566


© mrc. All rights reserved.