mrc logo mrc logo
  • m-Power m-Power
    What is m-Power?
    Overview Demos Build Process Case Studies Specs Pricing Trial
    m-Power Resources
    Overview How-To Videos Webinars & Podcasts White Papers Fact Sheets
  • Solutions Solutions
    What does m-Power build?
    Overview Database Front-Ends Reporting CRM Systems Business Intelligence Dashboards Inventory Management Mobile Apps ERP Enhancements Modernization Spreadsheets to the web MS Access to the web B2B/Web Portals Scheduling Embedded Analytics Web Forms Workflow Data Exploration Budgeting & Forecasting APIs and Web Services Db2 Web Query Alternative
    Solutions by Industry
    Overview Manufacturing Government Foodservice Software Vendors Logistics & Supply Chain Software Consultants Healthcare
  • Services Services
    Development Services Training Mentoring
  • About About
    Overview Partners Press Releases Careers Events Contact Blog
  • Support Support
    Support Home FAQ Documentation Customer Portal Enhancements Updates Roadmap Techblog
Try m-Power

m-Power Manual

Browse:

  • Home
  • Graphs
  • Levels Tab
Back to Manual

Levels Tab


  • Learn more about each tab:

    • Graph Type Tab
    • Fields Tab
    • Levels Tab
    • Descriptions Tab
    • Options Tab:

      • General Tab
      • Title Tab
      • Legend Tab
      • Tooltip Tab
      • Drilldown Tab
      • Chart/Plot Tab
      • Chart Type-Specific Options:

        • 2D Bar Chart Options Tab
        • 3D Bar Chart Options Tab
        • 2D Clustered Bar Options Tab
        • 3D Clustered Bar Options Tab
        • 2D Stacked Bar Options Tab
        • 3D Stacked Bar Options Tab
        • Single-Line Chart Options Tab
        • Multi-Line Chart Options Tab
        • 2D Pie Options Tab
        • 3D Pie Options Tab
        • Speedometer Options Tab
        • Dial Chart Options Tab
           

In this tab, you will select from what rows in the report the graph will pull its data.

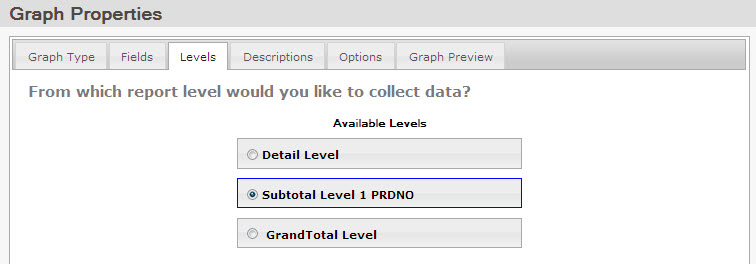
The level of detail depends on what you want to show and where that information is located on your report. Selecting the grand total row will display the final totals in each of the selected numeric fields. This is typically used when making a single line, bar, speedometer or dial chart. Selecting a subtotal row will have the chart display the values from each subtotal row. Single and grouped charts are commonly used with subtotal rows.

Note: When you set the level of your graph, this will also move the Image Data Collection tab. This icon serves as a reminder in m-Painter, and is only a placeholder. You can see this icon on the table image within m-Painter.

Created: January 5, 2011 | Modified: February 4, 2014

Search


Browse By Category

Build Process (13)
Starting with m-Power (8)
Retrievals (10)
Reports (15)
Summaries (4)
Maintainers (17)
Graphs (8)
m-Power Data Explorer (4)
General (24)
Calculations (5)
Utilities (9)
m-Power Administration (23)
Security (11)
Freemarker (6)
m-Painter (29)
Form Validation (5)
External Objects & UDFs (12)
Deprecated Documentation (23)
Bootstrap Templates (7)

Popular Tags

Freemarker Video Retrievals Dates Maintainers Form Validation Summaries m-Painter Data Dictionary SQL Calculations Security App Properties Dropdowns mrc-Productivity Series Build Process Administration Maintainer Excel Graphs External Objects Getting Started Bootstrap Templates Production DB2 Reports Graphing Email Java Report Application Properties Bar Graphs Graph Properties Retrieval Tomcat Advanced Admin Record Selections Performance Compiling Database RPG Prompt Screens Popular Parameters

See all tags »

michaels, ross & cole, ltd. (mrc)

Privacy Policy Cookie Policy Cookie Settings Notice at Collection Do Not Sell or Share My Personal Information

mrc (US)

2001 Midwest Road
Suite 310
Oak Brook, IL 60523
630-916-0662

mrc (UK)

Mortlake Business Centre
20 Mortlake High Street
London, SW14 8JN
+44-20-335-59566


© 2024 mrc. All rights reserved.