How to create a custom budgeting & forecasting portal
Full Transcript of Video
In this video, I’ll show you how easily you can create a custom budgeting and forecasting portal for your organization.
Now, before I start building…let me quickly show you a demo of what we’re creating today. I have a budgeting and forecasting portal here for a fictional bicycle manufacturer. Keep in mind that when it comes to budgeting, everyone does things differently. This budget isn’t meant to fit everyone’s needs. Rather, I want to show you how easily you can create a custom budget and forecast that fits your needs–whatever they are.
So, let’s check it out. Here we have a list of my budgeted expenses on a quarterly basis. I made this budget quarterly, but I could just as easily do any timeframe. Here I can view expenses by department, or by category. You’ll notice that I can drill into each option here, and there’s a nice little chart down here.
I also have a quarterly sales forecast over here. I can view my sales projections by region like it is now, or even switch up and view projections by product category or salesperson. These dimensions impact the drill-downs…so if I wanted to say…view by category and then drill into salesperson forecast by category, I can do that.
And finally, moving along this menu, I can view a report with past sales vs forecasts. That way I can keep track of how our projections are doing so far this year, view historical sales data, and even pinpoint areas that need more focus. For instance, if I view this data by salesperson and category, I can see that Chad is falling short of his bicycle projections this year, but historically has been a great salesperson.
Okay, so that’s an overview of my sales forecast and budgeted expenses…but where is this data coming from? How do I get it into the system and maintain it? On the forecast side, I have a place where my Sales Director can come in and list forecasted sales by salesperson, category, and month. I can update each one…let’s say that Anne’s bicycle projections are a little low. Let’s bump that up here and you’ll see that it shows up in the list. I can even add new projections up here.
And keep in mind that this all has role level and multi-tenant security on it. Right now I’m logged in as an admin so I can see everything, but…if I were to login as say…the marketing director…I can’t even see the sales forecasts, or even the company budget overview for that matter.
In fact, I can only see marketing data…and it’s set up like that for every department head. If I go to maintain my budget, I only see marketing items. I can update each one or add new expenses up here. Now, I realize that adding or editing one expense at a time isn’t that efficient. So I also have a way to bulk edit my projected expenses here, which gives me sort of a spreadsheet view. Or, if I want to quickly add a bunch of items, I can open up this view over here and add multiple expenses at the same time. Or…if one of the department heads would rather work in excel and then upload that data to the budget, they can do that here.
Okay, so that’s what we’re building today. Before I make it, let me quickly explain what goes into all of this. If I break that budgeting and forecasting portal into parts, we have a few different pieces. We have a few database tables–one with budgeting data, one with future forecasting data, one with past sales data, and one with past forecast data. Over the budgeting and forecasting tables, we have ways to add and maintain data, and those reports you saw that display the data in an easily understandable format. The sales vs forecast report pulls data from two tables–the forecast and sales tables. These are all wrapped up in a secure portal with role-based security so each of our department heads can only see the data they’re authorized to see.
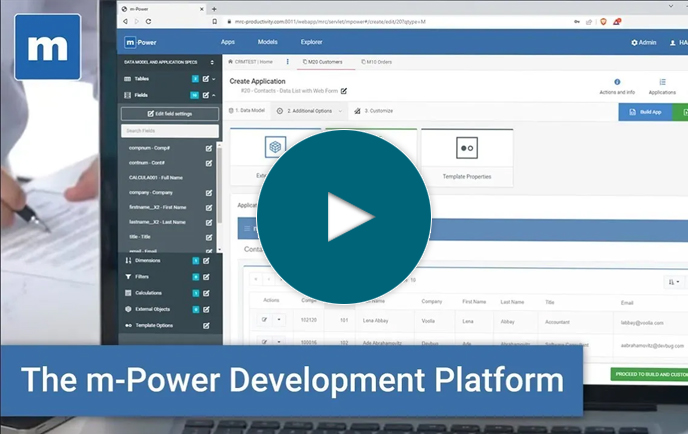
Alright, that’s what we’re building, now let me show you how to do it. I’ll be using the m-Power Development Platform since it makes custom web app development so simple.
Let’s dive right in. I’ll start by creating the budgeted expenses pieces, where I can add, update, and manage expenses. I just need provide a name and choose a template here…and templates provide the foundation, layout, and features for all apps–but are also completely customizable. Now, I need to tell m-Power where my database table is…and I already have one set up, but if I didn’t, I could just as easily create one here just by uploading a spreadsheet. However, I’m using an existing table this time. Once I select all of my fields in that table, I want to add a couple of dropdowns here in the field settings. I have some dropdown boxes for departments and budget categories so users don’t have to type each one in every time and so I don’t have to worry about them misspelling things and messing up my data. Okay, now I move on to the next step where I tell m-Power how to sort my data. Once that’s done, I get a preview of what I’m building here and I can click build and wait while m-Power puts this together for me. You’ll notice that there’s no coding involved and it only took a few minutes.
Now that it’s done, let’s check it out. I have a list of budgeted expenses. I can edit each one here. Let’s say that I want to bump this up a little bit. I’ll save that and you’ll see that the change appears. I can even add new expenses up here. Let’s quickly add one just to show you that it works. I just need to estimate the amount for the next three months and click accept. Now, that appears in my list.
Okay, so moving right along, I have a way to manage my budget data. Now, let’s make a report so company leaders can easily view this data. It’s the same process as before, I just need to choose a different template, which in this case is the interactive report template. I’m going to speed through the rest of the process as it’s the exact same steps as you just saw and I’m building it over the same data. Now, it’s just a matter of letting m-Power put it all together for me. You’ll notice that even though I’m building a report this time, the build process is the same as the last one–just with a different template.
Okay, let’s check it out. As you can see, it works great right out of the box. I can view my budgeted expenses by department…or…move this up and view by category. I can even sort by amount or month and you see that the graph redraws itself to match. So, this report gives our company leaders a quick overview of the budgeted expenses for the next three months. I don’t have security on here to make sure that only executives can view it, but we’ll add that later.
Now, if you recall in the demo, I had a few different ways to add data to this budget–a spreadsheet upload option, a bulk edit option, and a bulk add option. These are all made the exact same way as you just saw twice now, only using different templates built over that same database table. So, rather than make each one and show you the same process over and over, I’ll make them in the background here and then skip ahead.
Okay, so now they’re all ready. I have a way to upload budget data to that database table…a way to add multiple rows at the same time…and a way to edit in bulk here.
Okay, I’ve made all of the budgeting pieces…which if you recall the graphic from the beginning, are these right here. Now, I just need to throw the forecasting pieces together and we’re all set.
I’m going to go through these pretty quick since it’s all the same process that you saw before, only over different data. Instead of using my budget data table, I’m building over my forecast data table. Now, this is for the sales director to come in and add sales projections for each product category and salesperson. Then, those projections will be displayed in a report for business leaders to view. So, I’m almost done with this already. I’m just adding dropdown boxes again like I did in the budget one. Then, I just need to sort my application and wait while m-Power puts it together. Now keep in mind that I’m making simple applications here, but if I wanted to, I could add calculated fields, external business logic, filters, and more. I just don't need to for what I’m making now.
Okay, so this is built, let's check it out. Here my sales director can adjust sales forecasts for each salesperson, or even add new forecasts. Let’s say that I need to add clothing sales projections for Mary Porter. Based on prior sales and expected deals, they should be able to sell 7,000 dollars worth of clothing in April, 8 in May, and up to 10 in June. Once I accept that, you’ll that it shows up here.
Now that I have a way to manage my forecast data, I’ll make a report so business executives can view that forecast data. I’ll make it in the background since you already saw the process with the last report. Once it’s done, let’s check it out. Here I can view sales forecasts by region…salesperson…or product. The drill downs are built in and the graph redraws itself depending on which dimensions I choose. It’s pretty nice considering how easy it is to build.
Alright, one more thing to do. I just need to build that report that compares past sales to past sales forecasts. This one is slightly different, so I’ll quickly walk you through it. Once I name my report and choose a template, I’ll start by choosing my sales data. Then, I need to connect this table to my past forecast data…which is really pretty easy. Once I do that, I can choose those forecast fields. Now, I need to organize the fields a little bit so each year’s forecast and sales data are right next to each other, which is just a matter of dragging and dropping. Okay, now I just need to sort the data…and build the report. See…that one was a little different in the fact that I needed to join two tables together, but again…still easy. After this is built, I’m going to add some color coding to this report off screen using m-Painter, which is m-Power's visual editor. I’m not showing you because it would add a few minutes to the video and…it’s not the point of this video–it’s just a nice touch.
Okay, let’s check it out. I have a nice report here that gives me a quick overview of actual sales data vs forecasted sales data. I have some nice color coding in here to highlight what’s doing well and what needs work. And, we have the dimensions on the side here so we can view this data from different angles. Overall, it’s a pretty useful report to have and easy to build.
Okay, so finally I have all of my different pieces I need for this budgeting and forecasting portal. Now, let’s wrap it all up into a nice secure portal. The first thing I need to do is turn on security, which will force users to login before accessing the budget or forecast pieces. Of course, if I make users login, I’d better have some users setup, which I do right here. Each user has a role based on the department they’re in, which will come in handy during the next step.
All I need to do is add everything that I just built into a portal. To do that, I’ll add each option here. I’ll walk you through the first one and then do the rest in the background. So I’m adding that forecast report. I just need to get a nice icon here…and select which roles can view this. Since this is my sales forecast data, I just want my executive team and sales director to access this. Once that’s saved, it will appear in my portal.
Now, I just need to do that for the rest of the items in my portal…and I won’t show you all of that. I’ll just do it now and skip the video ahead. Okay, we have all of the menu options for our portal. So, let’s check it out. I’ll log in as an admin first, just to show you that the admin can view everything. You’ll see that with the menu items set up, everything is displayed in a nice portal format. The information is broken up into tabs here, or I can navigate between everything using this nav menu up here. Now, I can see everything because I’m logged in as an admin, but if I were to logout and log back in as the…HR director, you’ll see that I can only see budget items–no reports or sales forecasts are available since I’m not logged in as a sales director or admin.
Now, the last issue we need to address is right here. I’m logged in as the HR director but I can still see and manage budget data from other departments. Since this portal is to be used by different department leaders, I only want them to be able to see their own data. So, when our marketing director logs in, they shouldn’t see HR or IT’s budget and so on. We can fix that by adding multi-tenant security, which controls data access on the row level so multiple people can login to the same application but only see their data. With m-Power, adding multi-tenant security is really easy. I can build reusable security objects, which I can then use to secure any application.
While I explained all that I just built the security object we need to secure everything…but I didn’t walk you through it because it’s the same process as before…as you probably saw. This basically connects my registered user ids to departments and filters out everything else. I just need to add this object as a filter to anything I want to secure, which in this case is my budget. So now I just need to rebuild this and we should be good to go. The really nice part about this approach to multi-tenant security is the fact that it’s reusable. Now that I built it, I can use it to add multi-tenant security to any application I want.
So, now that our budget is rebuilt with our security object, let’s log in and see if it worked. I’ll login as the marketing director this time, and if it’s working as it should, I should be only able to see marketing department data when I view the budget…which is exactly what I see. So, this is working great. We now have a budgeting and forecasting portal that has role-level and multi-tenant security to ensure that users can only see data they’re authorized to see.
So that’s it. In a little over 10 minutes I’ve put together a custom budgeting and forecasting portal for a fictional company…complete with security. Now, again, every company is different. You probably want a slightly different budgeting portal. That’s the great part about what I just showed you. It’s so easy to create a custom solution that perfectly fits your business.
If you’d like to learn more or set up a demo, visit us on the web at mrc-productivity.com. Thanks for watching.
Learn how m-Power can help you
Sign up for a free trial
More Videos
Sort videos by category using the options below