How to create a web pivot table
Full Transcript of Video
In this video, I’ll show you how to create a web-based pivot table in about 5 minutes.
To start things off, let’s take a look at my data. Here I have a spreadsheet of sales and forecast data for my fictional bike company. It’s broken down by sales region, salesperson, category, and product for the last 3 years.
Now, there’s a lot of data here and I want to put it into a pivot table so I can easily analyze it from different angles and compare actual sales vs. forecast.
I could do that here in Excel, but making a web-based pivot table is better for a few reasons. It’s easier to share with others, it gives me a single version of truth…so I don’t have multiple spreadsheets floating around, and it lets me add security.
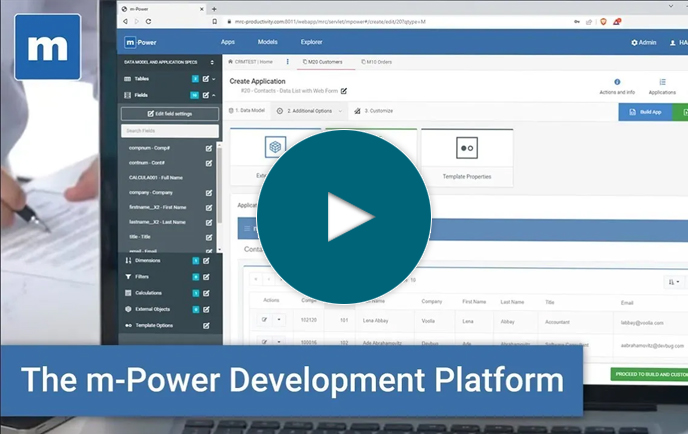
So, that’s why I want to create a web pivot table, now let me show you how. I’ll be using our development platform, m-Power, as it makes the process so simple.
To get started I’ll need to name my report and choose a template–which basically provides the layout and features for the application I’m creating.
Now, I need to tell m-Power where my data is…but it’s still in that spreadsheet. So, I’ll just upload that spreadsheet into a database table. Now here, m-Power has analyzed my spreadsheet and created field names, types, and sizes based on the data. I can adjust any of that here…but I don’t need to this time so I’ll just move right along.
Okay, so my spreadsheet is now in a database table. I’ll just select that table and choose all fields for my report.
Okay, so once I have my data selected, I’ll just tell m-Power which fields to use as dimensions. For a pivot table, these are the options I’ll be able to sort my report by.
Okay, so now I’m all done. Now, before I hit the build button, let me dive into the report designer options. Here, I can change a lot of features, including what type of report I want to create. Right now it’s a standard report, but I’d like to make it a pivot report. I could even come back later and make it an interactive report or ranking report if I want. It’s very flexible.
Also, over here, I can set which row and column fields should appear by default. Let’s make it default to show product categories as columns and region and salesperson as rows. And finally, I can even add filters. For instance, what if I want to have the option to only view data for one or two of my product categories. I’ll set up a filter that lets me or other users select which categories to display in my pivot table with checkboxes. Now, m-Power does let you create database-driven option lists that can be reused across all applications…but I don’t have any set up now so I’ll just add each option manually. Of course, if I was making a lot of applications, those database-driven option lists would save a lot of time.
Okay, that looks good. Now I’ll just build and wait while m-Power puts everything together here.
Now...how long did that take? Maybe 5 minutes at most and I’ve taken a spreadsheet and turned it into a pivot table. Now that it’s built, let’s check it out.
As you can see, it’s sorting my data by category up here and by region on the side. If I drill into each region, I can see each salesperson and their sales.
Now, what if I want to view this data differently. Maybe instead of salesperson, I want to drill into products. And…maybe I want to view 2021 sales data and forecast data. I can set up that view really fast. Now I can compare which regions met their forecast numbers last year and which are falling behind.
And finally, let’s check out that filter. What if I only want to see accessories? It’s pretty easy to filter my data that way. I could play around with this for quite a while and show you all the different ways to view your data…but for sake of time I’ll leave it here.
Now, I could do a lot more here. Because this is a web application, I’d just need to share this URL with anyone I want to view the data. But, what if I want to secure this data? I could go into m-Power and setup security so users would have to login to view the data. Or, I could add multi-tenant security, so each user can only see the data they’re authorized to see. Or, I could create applications to maintain this data. This is really just the tip of the iceberg here, but there’s a lot more possible.
If you’d like to learn more about m-Power or set up a demo, visit us on the web at mrc-productivity.com. Thanks for watching.
Learn how m-Power can help you
Sign up for a free trial
More Videos
Sort videos by category using the options below
