Create web-based reports with a database reporting tool
Full Transcript of Video
In this video, I’ll show you how to easily create web-based reports over your database using a report designer.
We’ll start with a few database tables and create a few different report types over that data…all in about 5 minutes.
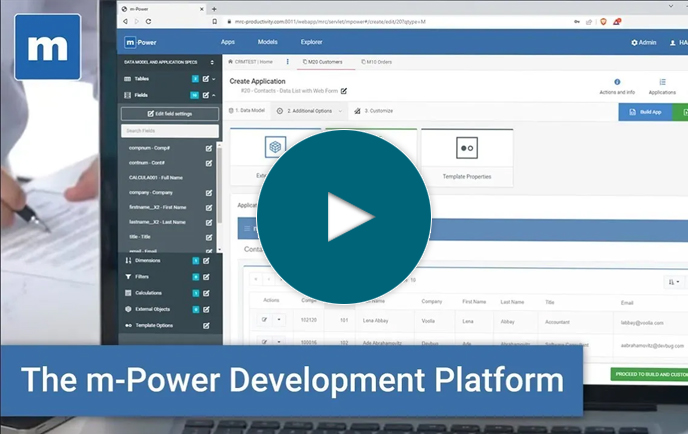
I’ll be using the m-Power Development Platform as it makes reporting so simple. Before we build the reports, lets take a quick look at our data.
So, I already have some tables in a MySQL database…but…the database type doesn’t matter. It can be any relational database like as400, postgres, mssql, you name it. I just happen to be using MySQL here, alright, but this process is the same regardless of database.
Now this is all data for a fictional company. I have customer data, sales data, product data, and more. If I dive into this table you can see I’m tracking sales data for the last three years.
So, I have all this data in here, but it doesn’t do a whole lot of good just sitting in my database. I can’t very well analyze my sales data like this. So, let’s quickly create some reports over some of this data. First things first, I’ll need to name my report and choose my template. A template basically gives the report a structure and layout, but can be customized later on.
Okay, so now I need to tell m-Power which database table to use. Now I want to analyze sales data in this report, so I’ll use the sales table…and select all fields in that table.
Moving on to the next step, I need to define a few dimensions for my report. These tell m-Power how to group and subtotal my data…it essentially dictates what data the report is going to let me analyze. Let’s add a few of these fields and then move on.
So, I’m actually all done with the required steps. Of course, there are optional steps like I can add calculated fields, filters, and custom logic…but I don’t need any of that this time.
Now I have two options, I can go into the report designer here and customize this report or I can build and run it as is. I’m going to build and run it first and then go back into the report designer and make some changes. This way you’ll see what a basic report looks like straight out of the box.
Okay, now that it’s built, let’s check it out. I can adjust the dimensions over here. Let’s quickly run it by category. Now I have a breakdown of sales data by product category. That’s all well and good, but what if I want to see it by say…I don’t know…category and region. Now I can see how different regions are doing by category. Or suppose I want to see the data by salesperson–it’s pretty easy to change that too. I could go on, but I’m sure you get the idea. It’s easy to view data from multiple angles.
Now suppose I want to view this data in a different format. Let’s jump into the report designer and see what we can do here.
I can do a lot in the report designer but let’s start by changing the format. Let’s say I want it to be…an interactive report. Once I make that change and run my report…you see that I now have an interactive layout. I have these nice drill down options here to dive deeper into my data. I can also drag and drop dimensions here on the left to view my data in different ways. Suppose I want to view my data by salesperson and product. I’ll just drag those dimensions and run the report. Now I start with the salesperson and I can drill into how many products they’ve sold. It’s a pretty nice and flexible layout for exploring lots of data easily.
Now, let’s suppose that I want to make some even bigger changes. I want to see this data in a different format but also want to see my forecasting data next to my sales data. Well…I don’t have forecast data in this table, so I’ll need to join out to my forecast database table. I just need to tell m-Power how these two tables are connected and it handles the joins for me. Now that I’ve joined to that table, I’ll just select a few sales forecast fields to include.
Okay, so I’ve added more data to this report…and that was really easy. Now let’s jump back into the report designer and change the format. Let’s view the data as a…pivot table now…and then adjust the default dimensions over here. This controls how the data is displayed when the report loads, but can always be changed by the user.
You know what, let me add one more thing here. I’ll add a quick filter on the category field so users can filter the data by a specific product category if they want. It’s not necessary for this report, but I’m doing it to show you how easily you can add run-time filters to reports. I could add filters on other fields as well, but I won’t for sake of time.
So now I just need to rebuild this report since I’ve added more data and a filter. But, I hope you understand how easy it is to change or update your reports if needed. In less than a minute I’ve joined out to another database table, pulled fields from that table, added a data filter, and changed the report format to a pivot table. And that’s really the nice part about this report designer. It’s so easy to change and update. Now, let’s run the report and see what we have.
This pivot table layout is pretty nice. I can select which value fields to include…lets say that I want to compare 2021 sales to 2021 forecasted sales. I’ll just rerun that and can now view that data. Of course, I can adjust the dimensions here as well just like I could with the interactive report. Suppose I want to view the data by salesperson and product here…but then I want to apply a filter to only view accessories. Alright? Now if I drill into a salesperson, I’ll only see their accessories sales. Pretty nice, huh?
So, that’s pretty much it. I could always come into the report designer and change more things like say…the table format up here…or I could adjust cell formatting and even add conditional formatting. But…I won’t get into all of that here for sake of time.
I do hope you have a feeling for how easily you can create reports over your database so you can quickly analyze your data and view it from different angles. If you’d like to learn more or set up a demo, visit us on the web at mrc-productivity.com.
Learn how m-Power can help you
Sign up for a free trial
More Videos
Sort videos by category using the options below