
Real-Time Analytics and Self-Service Reporting Across Devices
Showplace Wood Products ran reporting across two systems, Friedman ERP and Optimum HR, and their people still could not get numbers when they needed them. In this session Showplace walks through what they built, including the tablet reporting that let them drop their daily planning meeting.
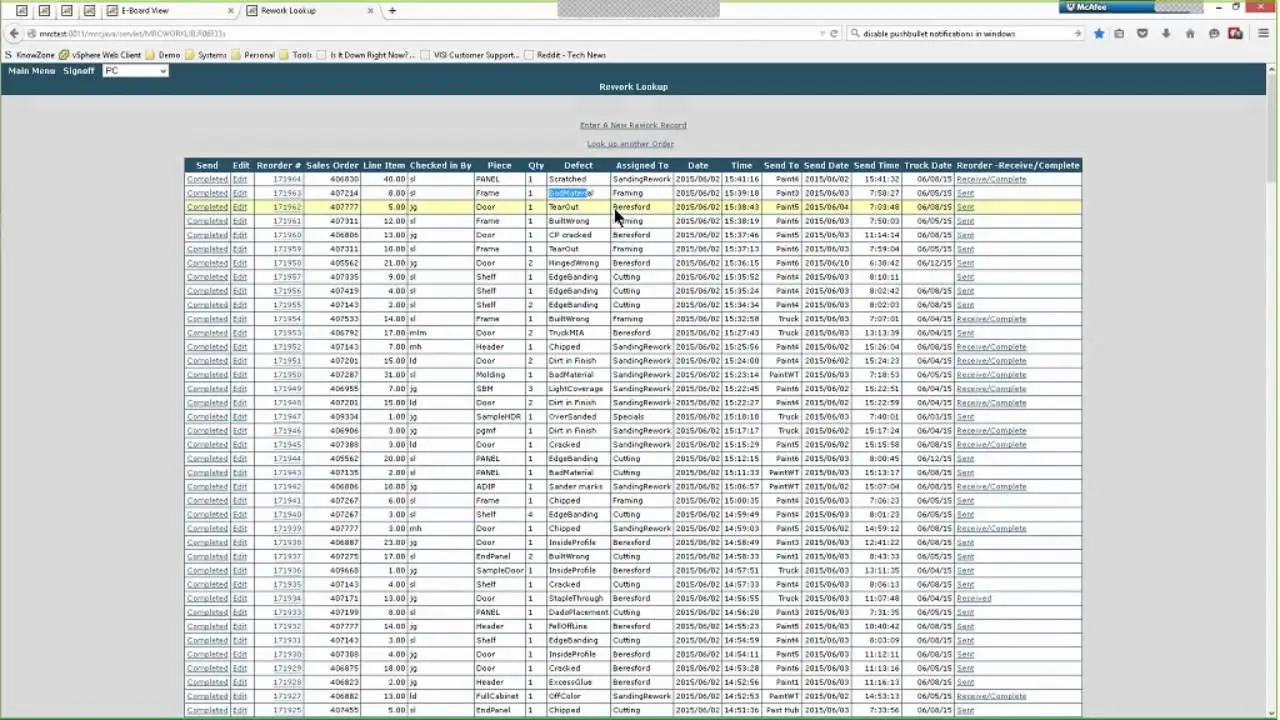
What Showplace covered
Showplace presents this one themselves, about 22 minutes. Here is what they cover:
Reporting across two systems at once
Real-time reports over Friedman ERP and Optimum HR together, rather than one set of numbers per system.
Self-service reports and web pivot tables
Their users build and filter their own views instead of routing every request through IT.
Tablets instead of a daily meeting
Getting live data onto tablets let them stop holding a daily planning meeting just to share numbers.
Applications like the ones Showplace showed
Showplace's own applications run inside their business, so we cannot link to those. These two are the same application types with the same capabilities.
Web pivot table
The same kind of pivot table shown in the session. Filter by several dimensions and view the data however you want.
KPI dashboard
The same dashboard type Showplace demonstrated. Pick your charts and control the layout.
See real-time reporting over your systems
We'll walk through m-Power live, using your data and your use case, and answer any questions your team has.